HSBC 2008 Annual Report Download - page 204
Download and view the complete annual report
Please find page 204 of the 2008 HSBC annual report below. You can navigate through the pages in the report by either clicking on the pages listed below, or by using the keyword search tool below to find specific information within the annual report.-
 1
1 -
2
-
3
-
4
-
5
-
6
-
7
-
8
-
9
-
10
-
11
-
12
-
13
-
14
-
15
-
16
-
17
-
18
-
19
-
20
-
21
-
22
-
23
-
24
-
25
-
26
-
27
-
28
-
29
-
30
-
31
-
32
-
33
-
34
-
35
-
36
-
37
-
38
-
39
-
40
-
41
-
42
-
43
-
44
-
45
-
46
-
47
-
48
-
49
-
50
-
51
-
52
-
53
-
54
-
55
-
56
-
57
-
58
-
59
-
60
-
61
-
62
-
63
-
64
-
65
-
66
-
67
-
68
-
69
-
70
-
71
-
72
-
73
-
74
-
75
-
76
-
77
-
78
-
79
-
80
-
81
-
82
-
83
-
84
-
85
-
86
-
87
-
88
-
89
-
90
-
91
-
92
-
93
-
94
-
95
-
96
-
97
-
98
-
99
-
100
-
101
-
102
-
103
-
104
-
105
-
106
-
107
-
108
-
109
-
110
-
111
-
112
-
113
-
114
-
115
-
116
-
117
-
118
-
119
-
120
-
121
-
122
-
123
-
124
-
125
-
126
-
127
-
128
-
129
-
130
-
131
-
132
-
133
-
134
-
135
-
136
-
137
-
138
-
139
-
140
-
141
-
142
-
143
-
144
-
145
-
146
-
147
-
148
-
149
-
150
-
151
-
152
-
153
-
154
-
155
-
156
-
157
-
158
-
159
-
160
-
161
-
162
-
163
-
164
-
165
-
166
-
167
-
168
-
169
-
170
-
171
-
172
-
173
-
174
-
175
-
176
-
177
-
178
-
179
-
180
-
181
-
182
-
183
-
184
-
185
-
186
-
187
-
188
-
189
-
190
-
191
-
192
-
193
-
 194
194 -
 195
195 -
 196
196 -
 197
197 -
 198
198 -
 199
199 -
 200
200 -
 201
201 -
 202
202 -
 203
203 -
 204
204 -
 205
205 -
 206
206 -
 207
207 -
 208
208 -
 209
209 -
 210
210 -
 211
211 -
 212
212 -
 213
213 -
 214
214 -
215
-
216
-
217
-
218
-
219
-
220
-
221
-
222
-
223
-
224
-
225
-
226
-
227
-
228
-
229
-
230
-
231
-
232
-
233
-
234
-
235
-
236
-
237
-
238
-
239
-
240
-
241
-
242
-
243
-
244
-
245
-
246
-
247
-
248
-
249
-
250
-
251
-
252
-
253
-
254
-
255
-
256
-
257
-
258
-
259
-
260
-
261
-
262
-
263
-
264
-
265
-
266
-
267
-
268
-
269
-
270
-
271
-
272
-
273
-
274
-
275
-
276
-
277
-
278
-
279
-
280
-
281
-
282
-
283
-
284
-
285
-
286
-
287
-
288
-
289
-
290
-
291
-
292
-
293
-
294
-
295
-
296
-
297
-
298
-
299
-
300
-
301
-
302
-
303
-
304
-
305
-
306
-
307
-
308
-
309
-
310
-
311
-
312
-
313
-
314
-
315
-
316
-
317
-
318
-
319
-
320
-
321
-
322
-
323
-
324
-
325
-
326
-
327
-
328
-
329
-
330
-
331
-
332
-
333
-
334
-
335
-
336
-
337
-
338
-
339
-
340
-
341
-
342
-
343
-
344
-
345
-
346
-
347
-
348
-
349
-
350
-
351
-
352
-
353
-
354
-
355
-
356
-
357
-
358
-
359
-
360
-
361
-
362
-
363
-
364
-
365
-
366
-
367
-
368
-
369
-
370
-
371
-
372
-
373
-
374
-
375
-
376
-
377
-
378
-
379
-
380
-
381
-
382
-
383
-
384
-
385
-
386
-
387
-
388
-
389
-
390
-
391
-
392
-
393
-
394
-
395
-
396
-
397
-
398
-
399
-
400
-
401
-
402
-
403
-
404
-
405
-
406
-
407
-
408
-
409
-
410
-
411
-
412
-
413
-
414
-
415
-
416
-
417
-
418
-
419
-
420
-
421
-
422
-
423
-
424
-
425
-
426
-
427
-
428
-
429
-
430
-
431
-
432
-
433
-
434
-
435
-
436
-
437
-
438
-
439
-
440
-
441
-
442
-
443
-
444
-
445
-
446
-
447
-
448
-
449
-
450
-
451
-
452
-
453
-
454
-
455
-
456
-
457
-
458
-
459
-
460
-
461
-
462
-
463
-
464
-
465
-
466
-
467
-
468
-
469
-
470
-
471
-
472
 |
 |

HSBC HOLDINGS PLC
Report of the Directors: Risk (continued)
Credit risk > Credit exposure > Concentration > 2008
202
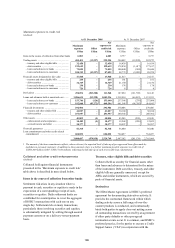
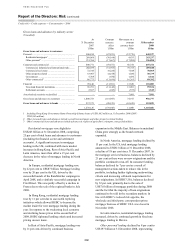
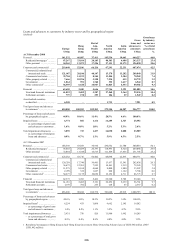
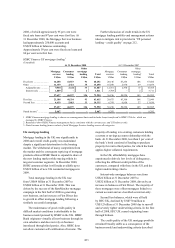
Gross loans and advances by industry sector
(Unaudited)
At
31 December
2007
Constant
currency
effect
Movement on a
constant
currency basis
At
31 December
2008
US$m US$m US$m US$m
Gross loans and advances to customers
Personal ......................................................................... 500,834 (47,831) (12,776) 440,227
Residential mortgages1 ............................................. 269,068 (30,164) 4,433 243,337
Other personal2 ......................................................... 231,766 (17,667) (17,209) 196,890
Corporate and commercial ........................................... 400,771 (59,671) 66,374 407,474
Commercial, industrial and international trade......... 202,038 (31,953) 39,755 209,840
Commercial real estate ............................................. 72,345 (9,224) 7,848 70,969
Other property-related .............................................. 33,907 (4,188) 1,020 30,739
Government .............................................................. 5,708 (650) 1,486 6,544
Other commercial3 .................................................... 86,773 (13,656) 16,265 89,382
Financial ....................................................................... 99,148 (11,391) 13,328 101,085
Non-bank financial institutions ................................ 96,781 (11,146) 13,901 99,536
Settlement accounts .................................................. 2,367 (245) (573) 1,549
Asset-backed securities reclassified ............................. – – 7,991 7,991
Gross loans and advances to customers ....................... 1,000,753 (118,893) 74,917 956,777
Gross loans and advances to banks .......................... 237,373 (20,125) (63,419) 153,829
1,238,126 (139,018) 11,498 1,110,606
1 Including Hong Kong Government Home Ownership Scheme loans of US$3,882 million at 31 December 2008 (2007:
US$3,942 million).
2 Other personal loans and advances include second lien mortgages and other property-related lending.
3 Other commercial loans and advances include advances in respect of agriculture, transport, energy and utilities.
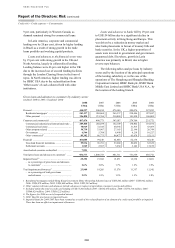
Residential mortgages rose slightly to
US$243 billion at 31 December 2008, comprising
25 per cent of total loans and advances to customers
(including the financial sector and settlement
accounts). A significant increase in mortgage
lending in the UK, combined with more modest
increases in Hong Kong, Rest of Asia-Pacific and
Latin America, more than offset a 15 per cent
decrease in the value of mortgage lending in North
America.
In Europe, residential mortgage lending rose
by 22 per cent to US$87 billion. Mortgage lending
rose by 26 per cent in the UK, driven by the
successful launch of the RateMatcher campaign in
April 2008, and a similarly successful campaign in
First Direct. This was partly offset by a decline in
France due to the sale of the regional banks in July
2008.
In Hong Kong, residential mortgage lending
rose by 11 per cent due to successful repricing
initiatives which allowed HSBC to become the
market leader for new mortgage lending during the
year. In response to the weakening local economy
and declining house prices in the second half of
2008, HSBC tightened lending criteria and increased
pricing on new loans.
In Rest of Asia-Pacific, mortgage lending rose
by 11 per cent, driven by continued business
expansion in the Middle East. Balances in mainland
China grew strongly as the branch network
expanded.
In North America, mortgage lending declined by
15 per cent. In the US, total mortgage lending
amounted to US$81 billion at 31 December 2008,
a decline of 18 per cent since 31 December 2007. In
the mortgage services business, balances declined by
21 per cent as there were no new originations and the
portfolio continued to run-off. In consumer lending,
balances declined by 7 per cent as a result of
management actions taken to reduce risk in the
portfolio, including further tightening underwriting
criteria and increasing collateral requirements for
new originations. In HSBC USA, balances declined
by 32 per cent, primarily due to the sale of
US$7.0 billion of mortgage portfolios during 2008
and the fact that the majority of loan originations
continued to be sold in the secondary markets. In
line with HSBC’s reduced risk appetite, the
wholesale and third-party correspondent prime
mortgage business of HSBC USA was closed in
November 2008.
In Latin America, residential mortgage lending
increased, driven by continued growth in fixed rate
mortgage lending in Mexico.
Other personal lending declined by 8 per cent to
US$197 billion at 31 December 2008, representing