HSBC 2008 Annual Report Download - page 80
Download and view the complete annual report
Please find page 80 of the 2008 HSBC annual report below. You can navigate through the pages in the report by either clicking on the pages listed below, or by using the keyword search tool below to find specific information within the annual report.-
 1
1 -
2
-
3
-
4
-
5
-
6
-
7
-
8
-
9
-
10
-
11
-
12
-
13
-
14
-
15
-
16
-
17
-
18
-
19
-
20
-
21
-
22
-
23
-
24
-
25
-
26
-
27
-
28
-
29
-
30
-
31
-
32
-
33
-
34
-
35
-
36
-
37
-
38
-
39
-
40
-
41
-
42
-
43
-
44
-
45
-
46
-
47
-
48
-
49
-
50
-
51
-
52
-
53
-
54
-
55
-
56
-
57
-
58
-
59
-
60
-
61
-
62
-
63
-
64
-
65
-
66
-
67
-
68
-
69
-
 70
70 -
 71
71 -
 72
72 -
 73
73 -
 74
74 -
 75
75 -
 76
76 -
 77
77 -
 78
78 -
 79
79 -
 80
80 -
 81
81 -
 82
82 -
 83
83 -
 84
84 -
 85
85 -
 86
86 -
 87
87 -
 88
88 -
 89
89 -
 90
90 -
91
-
92
-
93
-
94
-
95
-
96
-
97
-
98
-
99
-
100
-
101
-
102
-
103
-
104
-
105
-
106
-
107
-
108
-
109
-
110
-
111
-
112
-
113
-
114
-
115
-
116
-
117
-
118
-
119
-
120
-
121
-
122
-
123
-
124
-
125
-
126
-
127
-
128
-
129
-
130
-
131
-
132
-
133
-
134
-
135
-
136
-
137
-
138
-
139
-
140
-
141
-
142
-
143
-
144
-
145
-
146
-
147
-
148
-
149
-
150
-
151
-
152
-
153
-
154
-
155
-
156
-
157
-
158
-
159
-
160
-
161
-
162
-
163
-
164
-
165
-
166
-
167
-
168
-
169
-
170
-
171
-
172
-
173
-
174
-
175
-
176
-
177
-
178
-
179
-
180
-
181
-
182
-
183
-
184
-
185
-
186
-
187
-
188
-
189
-
190
-
191
-
192
-
193
-
194
-
195
-
196
-
197
-
198
-
199
-
200
-
201
-
202
-
203
-
204
-
205
-
206
-
207
-
208
-
209
-
210
-
211
-
212
-
213
-
214
-
215
-
216
-
217
-
218
-
219
-
220
-
221
-
222
-
223
-
224
-
225
-
226
-
227
-
228
-
229
-
230
-
231
-
232
-
233
-
234
-
235
-
236
-
237
-
238
-
239
-
240
-
241
-
242
-
243
-
244
-
245
-
246
-
247
-
248
-
249
-
250
-
251
-
252
-
253
-
254
-
255
-
256
-
257
-
258
-
259
-
260
-
261
-
262
-
263
-
264
-
265
-
266
-
267
-
268
-
269
-
270
-
271
-
272
-
273
-
274
-
275
-
276
-
277
-
278
-
279
-
280
-
281
-
282
-
283
-
284
-
285
-
286
-
287
-
288
-
289
-
290
-
291
-
292
-
293
-
294
-
295
-
296
-
297
-
298
-
299
-
300
-
301
-
302
-
303
-
304
-
305
-
306
-
307
-
308
-
309
-
310
-
311
-
312
-
313
-
314
-
315
-
316
-
317
-
318
-
319
-
320
-
321
-
322
-
323
-
324
-
325
-
326
-
327
-
328
-
329
-
330
-
331
-
332
-
333
-
334
-
335
-
336
-
337
-
338
-
339
-
340
-
341
-
342
-
343
-
344
-
345
-
346
-
347
-
348
-
349
-
350
-
351
-
352
-
353
-
354
-
355
-
356
-
357
-
358
-
359
-
360
-
361
-
362
-
363
-
364
-
365
-
366
-
367
-
368
-
369
-
370
-
371
-
372
-
373
-
374
-
375
-
376
-
377
-
378
-
379
-
380
-
381
-
382
-
383
-
384
-
385
-
386
-
387
-
388
-
389
-
390
-
391
-
392
-
393
-
394
-
395
-
396
-
397
-
398
-
399
-
400
-
401
-
402
-
403
-
404
-
405
-
406
-
407
-
408
-
409
-
410
-
411
-
412
-
413
-
414
-
415
-
416
-
417
-
418
-
419
-
420
-
421
-
422
-
423
-
424
-
425
-
426
-
427
-
428
-
429
-
430
-
431
-
432
-
433
-
434
-
435
-
436
-
437
-
438
-
439
-
440
-
441
-
442
-
443
-
444
-
445
-
446
-
447
-
448
-
449
-
450
-
451
-
452
-
453
-
454
-
455
-
456
-
457
-
458
-
459
-
460
-
461
-
462
-
463
-
464
-
465
-
466
-
467
-
468
-
469
-
470
-
471
-
472
 |
 |

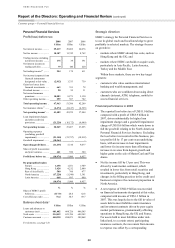
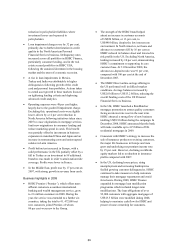
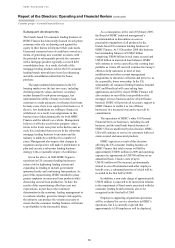
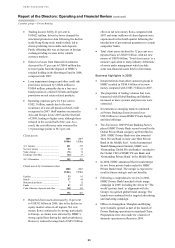
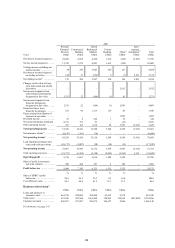
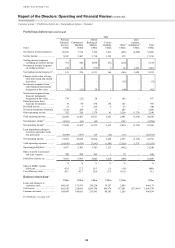
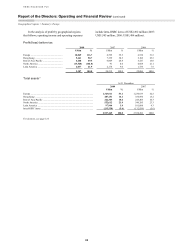
HSBC HOLDINGS PLC
Report of the Directors: Operating and Financial Review (continued)
Customer groups > Global Banking and Markets / Private Banking
78
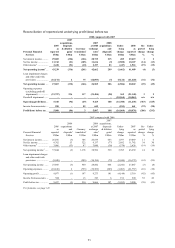
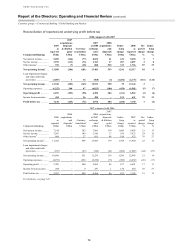
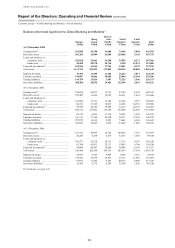
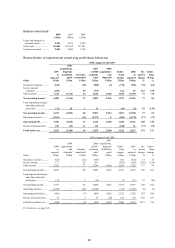
Balance sheet data significant to Global Banking and Markets15
Europe
Hong
Kong
Rest of
Asia-
Pacific
North
America
Latin
America
Total
US$m US$m US$m US$m US$m US$m
At 31 December 2008
Trading assets20 ................................................... 281,089 45,398 19,606 74,498 5,004 425,595
Derivative assets ................................................. 303,265 26,989 26,506 125,848 5,145 487,753
Loans and advances to:
– customers (net) ............................................ 185,818 23,042 34,590 35,583 8,273 287,306
– banks (net) ................................................... 49,508 20,970 26,710 9,238 12,574 119,000
Financial investments20 ....................................... 105,546 46,964 37,346 39,841 8,179 237,876
Total assets ......................................................... 1,131,721 225,853 172,049 318,139 48,868 1,896,630
Deposits by banks ............................................... 79,509 11,509 13,205 16,244 3,871 124,338
Customer accounts .............................................. 199,687 30,866 50,605 23,844 15,384 320,386
Trading liabilities ................................................ 144,759 13,056 3,687 72,325 2,546 236,373
Derivative liabilities ........................................... 300,200 28,536 26,481 122,699 4,615 482,531
At 31 December 2007
Trading assets20 ................................................... 294,078 26,877 19,732 93,395 8,570 442,652
Derivative assets ................................................. 102,409 11,492 10,234 56,531 1,814 182,480
Loans and advances to:
– customers (net) ............................................ 163,066 19,171 32,106 26,186 9,935 250,464
– banks (net) ................................................... 89,651 53,725 30,853 14,938 10,339 199,506
Financial investments20 ....................................... 94,416 46,765 39,448 33,273 10,155 224,057
Total assets ......................................................... 892,712 215,801 155,106 252,804 45,045 1,561,468
Deposits by banks ............................................... 85,315 6,251 17,174 14,825 2,830 126,395
Customer accounts .............................................. 163,713 37,364 54,120 30,732 13,950 299,879
Trading liabilities ................................................ 201,010 15,939 8,601 73,081 4,998 303,629
Derivative liabilities ........................................... 104,687 10,865 9,656 53,058 1,986 180,252
At 31 December 2006
Trading assets20 ................................................... 165,116 30,895 14,726 105,645 7,575 323,957
Derivative assets ................................................. 53,223 6,259 6,575 32,357 1,230 99,644
Loans and advances to:
– customers (net) ............................................ 140,277 20,270 24,311 17,215 8,147 210,220
– banks (net) ................................................... 63,788 45,023 22,171 15,862 9,704 156,548
Financial investments20 ....................................... 54,009 48,407 20,890 30,496 8,169 161,971
Total assets ......................................................... 526,468 182,540 109,535 203,639 37,564 1,059,746
Deposits by banks ............................................... 65,963 4,363 9,849 9,664 3,115 92,954
Customer accounts .............................................. 139,416 24,530 36,623 23,711 11,685 235,965
Trading liabilities ................................................ 97,015 17,292 6,243 88,275 4,898 213,723
Derivative liabilities ........................................... 55,581 6,376 6,149 32,148 1,266 101,520
For footnotes, see page 143.