HSBC 2008 Annual Report Download - page 7
Download and view the complete annual report
Please find page 7 of the 2008 HSBC annual report below. You can navigate through the pages in the report by either clicking on the pages listed below, or by using the keyword search tool below to find specific information within the annual report.-
 1
1 -
 2
2 -
 3
3 -
 4
4 -
 5
5 -
 6
6 -
 7
7 -
 8
8 -
 9
9 -
 10
10 -
 11
11 -
 12
12 -
 13
13 -
 14
14 -
 15
15 -
 16
16 -
 17
17 -
 18
18 -
19
-
20
-
21
-
22
-
23
-
24
-
25
-
26
-
27
-
28
-
29
-
30
-
31
-
32
-
33
-
34
-
35
-
36
-
37
-
38
-
39
-
40
-
41
-
42
-
43
-
44
-
45
-
46
-
47
-
48
-
49
-
50
-
51
-
52
-
53
-
54
-
55
-
56
-
57
-
58
-
59
-
60
-
61
-
62
-
63
-
64
-
65
-
66
-
67
-
68
-
69
-
70
-
71
-
72
-
73
-
74
-
75
-
76
-
77
-
78
-
79
-
80
-
81
-
82
-
83
-
84
-
85
-
86
-
87
-
88
-
89
-
90
-
91
-
92
-
93
-
94
-
95
-
96
-
97
-
98
-
99
-
100
-
101
-
102
-
103
-
104
-
105
-
106
-
107
-
108
-
109
-
110
-
111
-
112
-
113
-
114
-
115
-
116
-
117
-
118
-
119
-
120
-
121
-
122
-
123
-
124
-
125
-
126
-
127
-
128
-
129
-
130
-
131
-
132
-
133
-
134
-
135
-
136
-
137
-
138
-
139
-
140
-
141
-
142
-
143
-
144
-
145
-
146
-
147
-
148
-
149
-
150
-
151
-
152
-
153
-
154
-
155
-
156
-
157
-
158
-
159
-
160
-
161
-
162
-
163
-
164
-
165
-
166
-
167
-
168
-
169
-
170
-
171
-
172
-
173
-
174
-
175
-
176
-
177
-
178
-
179
-
180
-
181
-
182
-
183
-
184
-
185
-
186
-
187
-
188
-
189
-
190
-
191
-
192
-
193
-
194
-
195
-
196
-
197
-
198
-
199
-
200
-
201
-
202
-
203
-
204
-
205
-
206
-
207
-
208
-
209
-
210
-
211
-
212
-
213
-
214
-
215
-
216
-
217
-
218
-
219
-
220
-
221
-
222
-
223
-
224
-
225
-
226
-
227
-
228
-
229
-
230
-
231
-
232
-
233
-
234
-
235
-
236
-
237
-
238
-
239
-
240
-
241
-
242
-
243
-
244
-
245
-
246
-
247
-
248
-
249
-
250
-
251
-
252
-
253
-
254
-
255
-
256
-
257
-
258
-
259
-
260
-
261
-
262
-
263
-
264
-
265
-
266
-
267
-
268
-
269
-
270
-
271
-
272
-
273
-
274
-
275
-
276
-
277
-
278
-
279
-
280
-
281
-
282
-
283
-
284
-
285
-
286
-
287
-
288
-
289
-
290
-
291
-
292
-
293
-
294
-
295
-
296
-
297
-
298
-
299
-
300
-
301
-
302
-
303
-
304
-
305
-
306
-
307
-
308
-
309
-
310
-
311
-
312
-
313
-
314
-
315
-
316
-
317
-
318
-
319
-
320
-
321
-
322
-
323
-
324
-
325
-
326
-
327
-
328
-
329
-
330
-
331
-
332
-
333
-
334
-
335
-
336
-
337
-
338
-
339
-
340
-
341
-
342
-
343
-
344
-
345
-
346
-
347
-
348
-
349
-
350
-
351
-
352
-
353
-
354
-
355
-
356
-
357
-
358
-
359
-
360
-
361
-
362
-
363
-
364
-
365
-
366
-
367
-
368
-
369
-
370
-
371
-
372
-
373
-
374
-
375
-
376
-
377
-
378
-
379
-
380
-
381
-
382
-
383
-
384
-
385
-
386
-
387
-
388
-
389
-
390
-
391
-
392
-
393
-
394
-
395
-
396
-
397
-
398
-
399
-
400
-
401
-
402
-
403
-
404
-
405
-
406
-
407
-
408
-
409
-
410
-
411
-
412
-
413
-
414
-
415
-
416
-
417
-
418
-
419
-
420
-
421
-
422
-
423
-
424
-
425
-
426
-
427
-
428
-
429
-
430
-
431
-
432
-
433
-
434
-
435
-
436
-
437
-
438
-
439
-
440
-
441
-
442
-
443
-
444
-
445
-
446
-
447
-
448
-
449
-
450
-
451
-
452
-
453
-
454
-
455
-
456
-
457
-
458
-
459
-
460
-
461
-
462
-
463
-
464
-
465
-
466
-
467
-
468
-
469
-
470
-
471
-
472
 |
 |
5
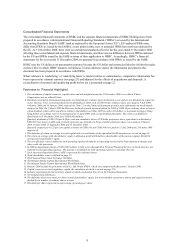
Consolidated Financial Statements
The consolidated financial statements of HSBC and the separate financial statements of HSBC Holdings have been
prepared in accordance with International Financial Reporting Standards (‘IFRSs’) as issued by the International
Accounting Standards Board (‘IASB’) and as endorsed by the European Union (‘EU’). EU-endorsed IFRSs may
differ from IFRSs as issued by the IASB if, at any point in time, new or amended IFRSs have not been endorsed by
the EU. At 31 December 2008, there were no unendorsed standards effective for the year ended 31 December 2008
affecting these consolidated and separate financial statements, and there was no difference between IFRSs endorsed
by the EU and IFRSs issued by the IASB in terms of their application to HSBC. Accordingly, HSBC’s financial
statements for the year ended 31 December 2008 are prepared in accordance with IFRSs as issued by the IASB.
HSBC uses the US dollar as its presentation currency because the US dollar and currencies linked to it form the major
currency bloc in which HSBC transacts its business. Unless otherwise stated, the information presented in this
document has been prepared in accordance with IFRSs.
When reference to ‘underlying’ or ‘underlying basis’ is made in tables or commentaries, comparative information has
been expressed at constant currency (see page 23) and adjusted for the effects of acquisitions and disposals. A
reconciliation of reported and underlying profit before tax is presented on page 22.
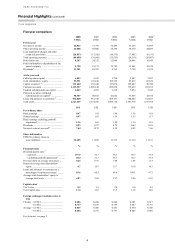
Footnotes to ‘Financial Highlights’
1 The calculation of capital resources, capital ratios and risk-weighted assets for 31 December 2008 is on a Basel II basis.
Comparatives are on a Basel I basis.
2 Dividends recorded in the financial statements are dividends per ordinary share declared in a year and are not dividends in respect of,
or for, that year. First, second and third interim dividends for 2008, each of US$0.18 per ordinary share, were paid on 9 July 2008,
8 October 2008 and 14 January 2009, respectively. Note 12 on the Financial Statements provides more information on the dividends
declared in 2008. On 2 March 2009 the Directors declared a fourth interim dividend for 2008 of US$0.10 per ordinary share in lieu of
a final dividend, which will be payable to ordinary shareholders on 6 May 2009 in cash in US dollars, or in pounds sterling or Hong
Kong dollars at exchange rates to be determined on 27 April 2009, with a scrip dividend alternative. The reserves available for
distribution at 31 December 2008 were US$18,838 million.
Quarterly dividends of US$15.50 per 6.20 per cent non-cumulative Series A US dollar preference share, equivalent to a dividend of
US$0.3875 per Series A ADS, each of which represents one-fortieth of a Series A dollar preference share, were paid on 17 March
2008, 16 June 2008, 15 September 2008 and 15 December 2008.
Quarterly coupons per 8.125 per cent capital securities of US$0.541 and US$0.508 were paid on 15 July 2008 and 15 October 2008
respectively.
3 The definition of return on average invested capital and a reconciliation to the equivalent GAAP measures are set out on page 19.
4 The return on average total shareholders’ equity is defined as profit attributable to shareholders of the parent company divided by
average total shareholders’ equity.
5 The cost efficiency ratio is defined as total operating expenses divided by net operating income before loan impairment charges and
other credit risk provisions.
6 In 2008 an impairment charge of US$10,564 million, to fully write off goodwill in Personal Financial Services in North America, was
reported in total operating expenses. This amount is excluded from total operating expenses to calculate the ratio.
7 Each American Depositary Share (‘ADS’) represents five ordinary shares.
8 Total shareholder return is defined on page 19.
9 The Financial Times Stock Exchange 100 Index.
10 The Morgan Stanley Capital International World Index.
11 The Morgan Stanley Capital International World Bank Index
12 Data for 2004 exclude the provisions of IAS 32, IAS 39 and IFRS 4, which were adopted with effect from 1 January 2005.
13 Capital resources are total regulatory capital, the calculation of which is set out on page 278.
14 Includes perpetual preferred securities, details of which can found in Note 32 on the Financial Statements.
15 Net of impairment allowances.
16 The definition of net asset value per share is total shareholders’ equity, less non-cumulative preference shares and capital securities,
divided by the number of ordinary shares in issue.
17 Dividends per share expressed as a percentage of earnings per share.