HSBC 2008 Annual Report Download - page 232
Download and view the complete annual report
Please find page 232 of the 2008 HSBC annual report below. You can navigate through the pages in the report by either clicking on the pages listed below, or by using the keyword search tool below to find specific information within the annual report.-
 1
1 -
2
-
3
-
4
-
5
-
6
-
7
-
8
-
9
-
10
-
11
-
12
-
13
-
14
-
15
-
16
-
17
-
18
-
19
-
20
-
21
-
22
-
23
-
24
-
25
-
26
-
27
-
28
-
29
-
30
-
31
-
32
-
33
-
34
-
35
-
36
-
37
-
38
-
39
-
40
-
41
-
42
-
43
-
44
-
45
-
46
-
47
-
48
-
49
-
50
-
51
-
52
-
53
-
54
-
55
-
56
-
57
-
58
-
59
-
60
-
61
-
62
-
63
-
64
-
65
-
66
-
67
-
68
-
69
-
70
-
71
-
72
-
73
-
74
-
75
-
76
-
77
-
78
-
79
-
80
-
81
-
82
-
83
-
84
-
85
-
86
-
87
-
88
-
89
-
90
-
91
-
92
-
93
-
94
-
95
-
96
-
97
-
98
-
99
-
100
-
101
-
102
-
103
-
104
-
105
-
106
-
107
-
108
-
109
-
110
-
111
-
112
-
113
-
114
-
115
-
116
-
117
-
118
-
119
-
120
-
121
-
122
-
123
-
124
-
125
-
126
-
127
-
128
-
129
-
130
-
131
-
132
-
133
-
134
-
135
-
136
-
137
-
138
-
139
-
140
-
141
-
142
-
143
-
144
-
145
-
146
-
147
-
148
-
149
-
150
-
151
-
152
-
153
-
154
-
155
-
156
-
157
-
158
-
159
-
160
-
161
-
162
-
163
-
164
-
165
-
166
-
167
-
168
-
169
-
170
-
171
-
172
-
173
-
174
-
175
-
176
-
177
-
178
-
179
-
180
-
181
-
182
-
183
-
184
-
185
-
186
-
187
-
188
-
189
-
190
-
191
-
192
-
193
-
194
-
195
-
196
-
197
-
198
-
199
-
200
-
201
-
202
-
203
-
204
-
205
-
206
-
207
-
208
-
209
-
210
-
211
-
212
-
213
-
214
-
215
-
216
-
217
-
218
-
219
-
220
-
221
-
 222
222 -
 223
223 -
 224
224 -
 225
225 -
 226
226 -
 227
227 -
 228
228 -
 229
229 -
 230
230 -
 231
231 -
 232
232 -
 233
233 -
 234
234 -
 235
235 -
 236
236 -
 237
237 -
 238
238 -
 239
239 -
 240
240 -
 241
241 -
 242
242 -
243
-
244
-
245
-
246
-
247
-
248
-
249
-
250
-
251
-
252
-
253
-
254
-
255
-
256
-
257
-
258
-
259
-
260
-
261
-
262
-
263
-
264
-
265
-
266
-
267
-
268
-
269
-
270
-
271
-
272
-
273
-
274
-
275
-
276
-
277
-
278
-
279
-
280
-
281
-
282
-
283
-
284
-
285
-
286
-
287
-
288
-
289
-
290
-
291
-
292
-
293
-
294
-
295
-
296
-
297
-
298
-
299
-
300
-
301
-
302
-
303
-
304
-
305
-
306
-
307
-
308
-
309
-
310
-
311
-
312
-
313
-
314
-
315
-
316
-
317
-
318
-
319
-
320
-
321
-
322
-
323
-
324
-
325
-
326
-
327
-
328
-
329
-
330
-
331
-
332
-
333
-
334
-
335
-
336
-
337
-
338
-
339
-
340
-
341
-
342
-
343
-
344
-
345
-
346
-
347
-
348
-
349
-
350
-
351
-
352
-
353
-
354
-
355
-
356
-
357
-
358
-
359
-
360
-
361
-
362
-
363
-
364
-
365
-
366
-
367
-
368
-
369
-
370
-
371
-
372
-
373
-
374
-
375
-
376
-
377
-
378
-
379
-
380
-
381
-
382
-
383
-
384
-
385
-
386
-
387
-
388
-
389
-
390
-
391
-
392
-
393
-
394
-
395
-
396
-
397
-
398
-
399
-
400
-
401
-
402
-
403
-
404
-
405
-
406
-
407
-
408
-
409
-
410
-
411
-
412
-
413
-
414
-
415
-
416
-
417
-
418
-
419
-
420
-
421
-
422
-
423
-
424
-
425
-
426
-
427
-
428
-
429
-
430
-
431
-
432
-
433
-
434
-
435
-
436
-
437
-
438
-
439
-
440
-
441
-
442
-
443
-
444
-
445
-
446
-
447
-
448
-
449
-
450
-
451
-
452
-
453
-
454
-
455
-
456
-
457
-
458
-
459
-
460
-
461
-
462
-
463
-
464
-
465
-
466
-
467
-
468
-
469
-
470
-
471
-
472
 |
 |

HSBC HOLDINGS PLC
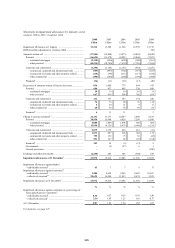
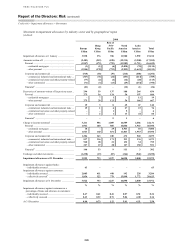
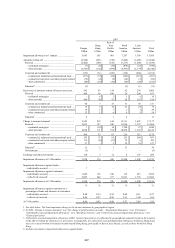
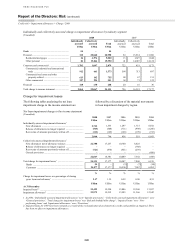
Report of the Directors: Risk (continued)
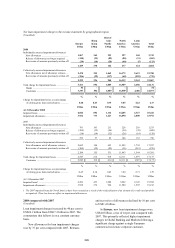
Credit risk > Impairment allowances > Charge > 2008 / 2007
230
Impairment charges against banks rose in the UK
due to exposures to the Icelandic banks in 2008.
New loan impairment charges rose in Turkey as
delinquency rates rose across credit cards, personal
loans and corporate lending in light of the
deteriorating economic environment. Elsewhere,
impairment charges on the commercial portfolio rose
in the UK, particularly in the final quarter of 2008 as
the weakening property market led to higher
impairment charges against construction companies
and businesses dependent upon the real estate sector.
In France, the impact of declining commercial credit
quality more than offset lower balances. Impairment
allowances against firms in the financial sector rose
due to exposure to a single asset management firm in
the UK. Credit quality in the UK personal lending
portfolio remained broadly stable, reflecting the
strength of HSBC’s loan book in a period of
significant economic uncertainty. Mortgage lending
in the UK remained well secured as risk mitigation
actions taken since 2006 reduced risk exposure to
some of the problems now being uncovered in the
UK residential property market. Credit quality in the
unsecured portfolios of M&S Money, HSBC Bank
and Partnership Cards deteriorated slightly in 2008,
particularly in the second half of the year, due to the
weakening UK economy.
Releases and recoveries in Europe declined by
27 per cent, driven by the deterioration in economic
conditions.
In Hong Kong, new loan impairment charges
more than doubled from a low base, driven by
deterioration in credit quality in the commercial
portfolio in the second half of the year as the
economy and trade flows weakened. Residential
mortgage lending continued to be well-secured, as
regulatory restrictions constrained origination loan-
to-value ratios to below 70 per cent.
In Rest of Asia-Pacific, new loan impairment
charges rose by 59 per cent to US$1.3 billion,
primarily in India and the Middle East. Higher
impairment charges in India were driven by a
combination of rising delinquency rates in consumer
lending, as credit conditions deteriorated, and
increased lending. Increased charges in the Middle
East were due to rising delinquencies as growth rates
declined and the property market retreated as
economic conditions deteriorated on the back of
lower oil and gas prices.
New loan impairment charges in North America
rose by 37 per cent to US$16.8 billion, driven by the
continued deterioration in credit quality in the HSBC
Finance loan portfolio and, to a lesser extent, in
HSBC USA.
US credit quality showed significant
deterioration across the portfolio, driven by the
continued weakness of the US economy. The reasons
behind the deterioration in US credit quality, the
effects on the US personal lending portfolio and
actions taken as a result are discussed in more detail
on page 210. Partly offsetting the effect of the
deterioration was a reduction in overall lending as
HSBC continued to reduce its exposure in the US.
In US card and retail services, impairment
charges rose, driven by portfolio seasoning, higher
levels of personal bankruptcy filings and continued
weakness in the US economy. Delinquency
increased in the geographical regions most affected
by house price falls and rising unemployment.
In Commercial Banking, impairment charges
rose from a low base driven by deterioration in the
commercial real estate loan book in the US, and
higher impairment charges against firms in the
manufacturing, export and commercial real estate
sectors in Canada. Higher impairment charges in
Global Banking and Markets reflected weaker credit
fundamentals in the US in 2008. Impairment
allowances against firms in the financial sector rose
due to rising delinquencies, despite government
intervention.
Releases and recoveries in North America rose
by 55 per cent to US$180 million.
In Latin America, new loan impairment
charges rose by 37 per cent to US$2.8 billion. The
most significant increase was in Mexico, reflecting
higher impairment charges in the credit card
portfolio due to a combination of higher average
balances from organic expansion and growing
delinquency rates driven by a deterioration in credit
quality as the 2006 and 2007 vintages continued to
season and move into later stages of delinquency.
Management action to improve the quality of new
business included tightened underwriting, enhanced
collection strategies and better managed customer
acquisition channels. The commercial portfolio in
Mexico also experienced higher impairment charges
due to credit quality deterioration among small and
medium sized enterprises as the economy weakened.
In Brazil, higher impairment charges were driven by
a combination of balance growth and credit quality
deterioration in the vehicle finance and payroll loan
portfolios.
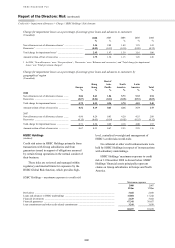
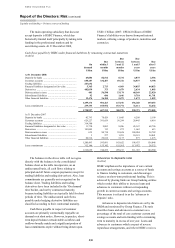
2007 compared with 2006
(Unaudited)
Loan impairment charges rose by 63 per cent to
US$17.2 billion from US$10.5 billion in 2006. The