HSBC 2008 Annual Report Download - page 71
Download and view the complete annual report
Please find page 71 of the 2008 HSBC annual report below. You can navigate through the pages in the report by either clicking on the pages listed below, or by using the keyword search tool below to find specific information within the annual report.-
 1
1 -
2
-
3
-
4
-
5
-
6
-
7
-
8
-
9
-
10
-
11
-
12
-
13
-
14
-
15
-
16
-
17
-
18
-
19
-
20
-
21
-
22
-
23
-
24
-
25
-
26
-
27
-
28
-
29
-
30
-
31
-
32
-
33
-
34
-
35
-
36
-
37
-
38
-
39
-
40
-
41
-
42
-
43
-
44
-
45
-
46
-
47
-
48
-
49
-
50
-
51
-
52
-
53
-
54
-
55
-
56
-
57
-
58
-
59
-
60
-
 61
61 -
 62
62 -
 63
63 -
 64
64 -
 65
65 -
 66
66 -
 67
67 -
 68
68 -
 69
69 -
 70
70 -
 71
71 -
 72
72 -
 73
73 -
 74
74 -
 75
75 -
 76
76 -
 77
77 -
 78
78 -
 79
79 -
 80
80 -
 81
81 -
82
-
83
-
84
-
85
-
86
-
87
-
88
-
89
-
90
-
91
-
92
-
93
-
94
-
95
-
96
-
97
-
98
-
99
-
100
-
101
-
102
-
103
-
104
-
105
-
106
-
107
-
108
-
109
-
110
-
111
-
112
-
113
-
114
-
115
-
116
-
117
-
118
-
119
-
120
-
121
-
122
-
123
-
124
-
125
-
126
-
127
-
128
-
129
-
130
-
131
-
132
-
133
-
134
-
135
-
136
-
137
-
138
-
139
-
140
-
141
-
142
-
143
-
144
-
145
-
146
-
147
-
148
-
149
-
150
-
151
-
152
-
153
-
154
-
155
-
156
-
157
-
158
-
159
-
160
-
161
-
162
-
163
-
164
-
165
-
166
-
167
-
168
-
169
-
170
-
171
-
172
-
173
-
174
-
175
-
176
-
177
-
178
-
179
-
180
-
181
-
182
-
183
-
184
-
185
-
186
-
187
-
188
-
189
-
190
-
191
-
192
-
193
-
194
-
195
-
196
-
197
-
198
-
199
-
200
-
201
-
202
-
203
-
204
-
205
-
206
-
207
-
208
-
209
-
210
-
211
-
212
-
213
-
214
-
215
-
216
-
217
-
218
-
219
-
220
-
221
-
222
-
223
-
224
-
225
-
226
-
227
-
228
-
229
-
230
-
231
-
232
-
233
-
234
-
235
-
236
-
237
-
238
-
239
-
240
-
241
-
242
-
243
-
244
-
245
-
246
-
247
-
248
-
249
-
250
-
251
-
252
-
253
-
254
-
255
-
256
-
257
-
258
-
259
-
260
-
261
-
262
-
263
-
264
-
265
-
266
-
267
-
268
-
269
-
270
-
271
-
272
-
273
-
274
-
275
-
276
-
277
-
278
-
279
-
280
-
281
-
282
-
283
-
284
-
285
-
286
-
287
-
288
-
289
-
290
-
291
-
292
-
293
-
294
-
295
-
296
-
297
-
298
-
299
-
300
-
301
-
302
-
303
-
304
-
305
-
306
-
307
-
308
-
309
-
310
-
311
-
312
-
313
-
314
-
315
-
316
-
317
-
318
-
319
-
320
-
321
-
322
-
323
-
324
-
325
-
326
-
327
-
328
-
329
-
330
-
331
-
332
-
333
-
334
-
335
-
336
-
337
-
338
-
339
-
340
-
341
-
342
-
343
-
344
-
345
-
346
-
347
-
348
-
349
-
350
-
351
-
352
-
353
-
354
-
355
-
356
-
357
-
358
-
359
-
360
-
361
-
362
-
363
-
364
-
365
-
366
-
367
-
368
-
369
-
370
-
371
-
372
-
373
-
374
-
375
-
376
-
377
-
378
-
379
-
380
-
381
-
382
-
383
-
384
-
385
-
386
-
387
-
388
-
389
-
390
-
391
-
392
-
393
-
394
-
395
-
396
-
397
-
398
-
399
-
400
-
401
-
402
-
403
-
404
-
405
-
406
-
407
-
408
-
409
-
410
-
411
-
412
-
413
-
414
-
415
-
416
-
417
-
418
-
419
-
420
-
421
-
422
-
423
-
424
-
425
-
426
-
427
-
428
-
429
-
430
-
431
-
432
-
433
-
434
-
435
-
436
-
437
-
438
-
439
-
440
-
441
-
442
-
443
-
444
-
445
-
446
-
447
-
448
-
449
-
450
-
451
-
452
-
453
-
454
-
455
-
456
-
457
-
458
-
459
-
460
-
461
-
462
-
463
-
464
-
465
-
466
-
467
-
468
-
469
-
470
-
471
-
472
 |
 |
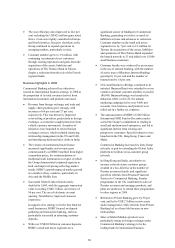
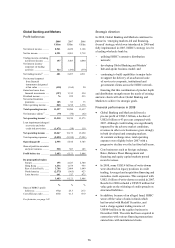
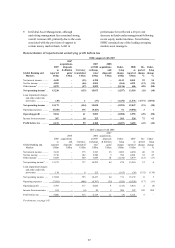
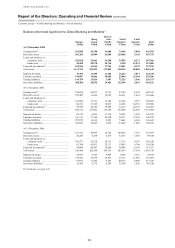
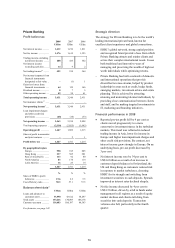
69
reduction in policyholder liabilities where
investment losses can be passed to
policyholders.
• Loan impairment charges rose by 32 per cent,
primarily due to further deterioration in credit
quality in the North American Personal
Financial Services business. Delinquency rates
increased across all portfolios in HSBC Finance,
particularly consumer lending, and in the real
estate secured portfolios in HSBC USA,
following the sustained downturn in the housing
market and the onset of economic recession.
• A rise in loan impairments in Mexico,
Turkey and India was attributable to higher
delinquencies following growth of the credit
card and personal loan portfolios. Actions taken
to curtail asset growth in these markets focused
on tightening lending criteria and deploying
advanced credit analytics.
• Operating expenses were 48 per cent higher,
largely due to the goodwill impairment charge.
Excluding this, operational costs were slightly
lower, driven by a 12 per cent reduction in
North America following initiatives taken since
2007 to cease originations in mortgage services,
limit new originations in consumer lending and
reduce marketing spend in cards. This benefit
was partially offset by investment in business
expansion in mainland China and Japan and an
increase in restructuring costs and union-agreed
salaries in Latin America.
• Profit before tax increased in Europe, with a
solid performance in the UK partially offset by a
fall in Turkey as an investment in 98 additional
branches was made in order to attain nationwide
coverage. Profits were lower in France.
• In the Middle East, profit rose by 17 per cent on
2007, with strong growth in revenue from cards.
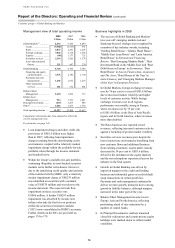
Business highlights in 2008
• HSBC Premier (‘Premier’), which offers mass
affluent customers a seamless international
banking and wealth management service, grew
to 2.6 million customers in 2008. During the
year, the service was extended to a further six
countries, taking the total to 41. 472,000 net
new customers joined Premier, of whom
80 per cent were new to the Group.
• The strength of the HSBC brand helped
attract an increase in customer accounts
of US$50 billion, or 13 per cent, to
US$440 billion, despite the low interest rate
environment. In North America, net loans and
advances to customers fell by 16 per cent as
HSBC reduced its balance sheet and lowered its
risk profile in the US. Excluding North America,
lending increased by 10 per cent, demonstrating
HSBC’s commitment to supporting its core
customer base. At 31 December 2008, the
advances-to-deposits ratio was 91 per cent,
compared with 106 per cent at the end of
December 2007.
• The HSBC Direct online savings offering in
the US performed well in difficult market
conditions. Average balances increased by
US$2.0 billion to US$13.2 billion, reducing the
overall funding costs of the US Personal
Financial Services business.
• In the UK, HSBC launched a RateMatcher
mortgage promotion to attract quality customers
facing an interest rate reset in the near term.
HSBC attracted a strong flow of new business
totalling US$9.9 billion during the campaign. In
December 2008, HSBC announced that the bank
will make available up to £15 billion of UK
residential mortgages in 2009.
• Consistent with HSBC’s strategy to increase the
sale of insurance products to existing customers,
the major life businesses in Europe and Asia
grew and underlying net premium income rose
by 15 per cent. However, declining worldwide
equity markets led to a reduction in insurance
profits compared with 2007.
• In the US, declining house prices, rising
unemployment and increasing bankruptcies
fuelled growing customer delinquencies. HSBC
continued to take measures to help customers
manage their mortgage repayments and avoid
foreclosure. During 2008, HSBC Finance
expanded its mortgage loan modification
programme which included longer-term
modifications. The loan obligations of over
92,000 customers with aggregate mortgages of
US$13.5 billion were modified during 2008,
helping to maximise cash flow for HSBC and
preserve home ownership for customers.