HSBC 2008 Annual Report Download - page 223
Download and view the complete annual report
Please find page 223 of the 2008 HSBC annual report below. You can navigate through the pages in the report by either clicking on the pages listed below, or by using the keyword search tool below to find specific information within the annual report.-
 1
1 -
2
-
3
-
4
-
5
-
6
-
7
-
8
-
9
-
10
-
11
-
12
-
13
-
14
-
15
-
16
-
17
-
18
-
19
-
20
-
21
-
22
-
23
-
24
-
25
-
26
-
27
-
28
-
29
-
30
-
31
-
32
-
33
-
34
-
35
-
36
-
37
-
38
-
39
-
40
-
41
-
42
-
43
-
44
-
45
-
46
-
47
-
48
-
49
-
50
-
51
-
52
-
53
-
54
-
55
-
56
-
57
-
58
-
59
-
60
-
61
-
62
-
63
-
64
-
65
-
66
-
67
-
68
-
69
-
70
-
71
-
72
-
73
-
74
-
75
-
76
-
77
-
78
-
79
-
80
-
81
-
82
-
83
-
84
-
85
-
86
-
87
-
88
-
89
-
90
-
91
-
92
-
93
-
94
-
95
-
96
-
97
-
98
-
99
-
100
-
101
-
102
-
103
-
104
-
105
-
106
-
107
-
108
-
109
-
110
-
111
-
112
-
113
-
114
-
115
-
116
-
117
-
118
-
119
-
120
-
121
-
122
-
123
-
124
-
125
-
126
-
127
-
128
-
129
-
130
-
131
-
132
-
133
-
134
-
135
-
136
-
137
-
138
-
139
-
140
-
141
-
142
-
143
-
144
-
145
-
146
-
147
-
148
-
149
-
150
-
151
-
152
-
153
-
154
-
155
-
156
-
157
-
158
-
159
-
160
-
161
-
162
-
163
-
164
-
165
-
166
-
167
-
168
-
169
-
170
-
171
-
172
-
173
-
174
-
175
-
176
-
177
-
178
-
179
-
180
-
181
-
182
-
183
-
184
-
185
-
186
-
187
-
188
-
189
-
190
-
191
-
192
-
193
-
194
-
195
-
196
-
197
-
198
-
199
-
200
-
201
-
202
-
203
-
204
-
205
-
206
-
207
-
208
-
209
-
210
-
211
-
212
-
 213
213 -
 214
214 -
 215
215 -
 216
216 -
 217
217 -
 218
218 -
 219
219 -
 220
220 -
 221
221 -
 222
222 -
 223
223 -
 224
224 -
 225
225 -
 226
226 -
 227
227 -
 228
228 -
 229
229 -
 230
230 -
 231
231 -
 232
232 -
 233
233 -
234
-
235
-
236
-
237
-
238
-
239
-
240
-
241
-
242
-
243
-
244
-
245
-
246
-
247
-
248
-
249
-
250
-
251
-
252
-
253
-
254
-
255
-
256
-
257
-
258
-
259
-
260
-
261
-
262
-
263
-
264
-
265
-
266
-
267
-
268
-
269
-
270
-
271
-
272
-
273
-
274
-
275
-
276
-
277
-
278
-
279
-
280
-
281
-
282
-
283
-
284
-
285
-
286
-
287
-
288
-
289
-
290
-
291
-
292
-
293
-
294
-
295
-
296
-
297
-
298
-
299
-
300
-
301
-
302
-
303
-
304
-
305
-
306
-
307
-
308
-
309
-
310
-
311
-
312
-
313
-
314
-
315
-
316
-
317
-
318
-
319
-
320
-
321
-
322
-
323
-
324
-
325
-
326
-
327
-
328
-
329
-
330
-
331
-
332
-
333
-
334
-
335
-
336
-
337
-
338
-
339
-
340
-
341
-
342
-
343
-
344
-
345
-
346
-
347
-
348
-
349
-
350
-
351
-
352
-
353
-
354
-
355
-
356
-
357
-
358
-
359
-
360
-
361
-
362
-
363
-
364
-
365
-
366
-
367
-
368
-
369
-
370
-
371
-
372
-
373
-
374
-
375
-
376
-
377
-
378
-
379
-
380
-
381
-
382
-
383
-
384
-
385
-
386
-
387
-
388
-
389
-
390
-
391
-
392
-
393
-
394
-
395
-
396
-
397
-
398
-
399
-
400
-
401
-
402
-
403
-
404
-
405
-
406
-
407
-
408
-
409
-
410
-
411
-
412
-
413
-
414
-
415
-
416
-
417
-
418
-
419
-
420
-
421
-
422
-
423
-
424
-
425
-
426
-
427
-
428
-
429
-
430
-
431
-
432
-
433
-
434
-
435
-
436
-
437
-
438
-
439
-
440
-
441
-
442
-
443
-
444
-
445
-
446
-
447
-
448
-
449
-
450
-
451
-
452
-
453
-
454
-
455
-
456
-
457
-
458
-
459
-
460
-
461
-
462
-
463
-
464
-
465
-
466
-
467
-
468
-
469
-
470
-
471
-
472
 |
 |
221
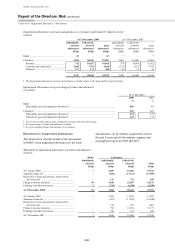
2008 compared with 2007
(Unaudited)
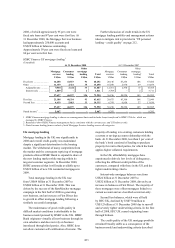
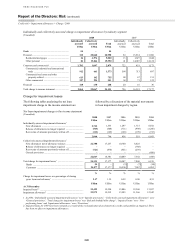
Total impaired loans to customers were
US$25.4 billion at 31 December 2008, an increase
of 29 per cent since the end of 2007 (42 per cent at
constant currency). Impaired loans were 3 per cent
of gross customer loans and advances, a rise from
2 per cent at 31 December 2007.
The commentary that follows compares
balances at 31 December 2008 with those at
31 December 2007, at constant exchange rates.
In Europe, impaired loans at US$6.8 billion
were 32 per cent higher than at the end of 2007. The
increase was driven by the UK where credit quality
in the UK commercial portfolio deteriorated sharply
in the final quarter of the year. A small number of
exposures in the commercial real estate sector were
particularly affected by a sharp deterioration in
market conditions in the fourth quarter. UK
mortgage impairments remained broadly stable
despite the substantial increase in balances in the
second half of the year and delinquency levels
increased modestly from a low base. Unsecured
personal lending in the UK also saw a slight increase
in the levels of impaired loans, particularly in the
second half of the year, as the economy weakened.
A single financial sector loan in Europe also affected
results. Impairment levels in France remained low in
the personal sector. However, Commercial Banking
experienced a rising number of small impairments
during the second half of the year and a small
number of larger impairments in the last quarter. In
Turkey, impaired loans rose by 81 per cent due to
increased delinquency in the personal lending
portfolio and, particularly, in credit cards.
In Hong Kong, impaired loans increased from a
previously low level to US$852 million. The
deterioration was concentrated in the commercial
lending portfolio and was attributable to a number of
factors including exporters in Hong Kong being
affected by reduced demand from the US and other
developed countries. The sharp fall in the value of
currencies and commodities left some customers’
balance sheets weakened, coupled with rising fraud
encountered with certain counterparties.
In the Rest of Asia-Pacific impaired loans
increased by 8 per cent to US$1.1 billion, primarily
due to the deterioration in the commercial lending
portfolio. In the last quarter of 2008 the number of
export orders suffered a sharp fall and, together with
a deterioration in credit quality around the region,
caused a rise in impaired loans. Noticeable increases
were recognised in Taiwan, Indonesia and India. In
Taiwan the commercial loan portfolio started to
deteriorate in the second half of the year as the fall
in exports started to affect local businesses. In
Indonesia and India, the increase in impaired loans
was a result of the downgrade of a few individual
customers as economic conditions worsened.
Impaired personal loans rose as increased
unemployment and bankruptcy rates affected the
ability of customers to repay. India continued to
show significant impaired loans as the economic
conditions deteriorated and credit quality weakened.
Active measures are being taken to reduce exposure
in India and manage the personal lending portfolio.
In North America, impaired loans rose
significantly, increasing by 49 per cent to
US$14.3 billion at 31 December 2008. The US
consumer finance business experienced a broad
based deterioration in credit quality due to higher
unemployment as the economy slowed. A full
discussion of these developments and their effect
on credit quality is provided in the ‘Areas of special
interest’ commentary on page 208. In Canada,
impaired loans rose from a low base as credit
conditions weakened, with the loss concentrated
in a single exposure in the commercial real estate
portfolio. In the US, commercial and corporate credit
quality declined due to downgrades as the economic
environment deteriorated.
In Latin America, impaired loans increased
by 37 per cent to US$2.3 billion. Impaired loans in
Mexico rose by 32 per cent, largely in credit cards
driven by portfolio growth in personal lending,
seasoning and higher delinquency rates. In Brazil,
impaired loans rose by 34 per cent due to growth in
personal lending due to deterioration in payroll and
vehicle finance loan portfolios, and weakness in a
number of real estate portfolios and corporates
exposed to the sharp rise in the value of the US
dollar in the second half of the year.