HSBC 2008 Annual Report Download - page 143
Download and view the complete annual report
Please find page 143 of the 2008 HSBC annual report below. You can navigate through the pages in the report by either clicking on the pages listed below, or by using the keyword search tool below to find specific information within the annual report.-
 1
1 -
2
-
3
-
4
-
5
-
6
-
7
-
8
-
9
-
10
-
11
-
12
-
13
-
14
-
15
-
16
-
17
-
18
-
19
-
20
-
21
-
22
-
23
-
24
-
25
-
26
-
27
-
28
-
29
-
30
-
31
-
32
-
33
-
34
-
35
-
36
-
37
-
38
-
39
-
40
-
41
-
42
-
43
-
44
-
45
-
46
-
47
-
48
-
49
-
50
-
51
-
52
-
53
-
54
-
55
-
56
-
57
-
58
-
59
-
60
-
61
-
62
-
63
-
64
-
65
-
66
-
67
-
68
-
69
-
70
-
71
-
72
-
73
-
74
-
75
-
76
-
77
-
78
-
79
-
80
-
81
-
82
-
83
-
84
-
85
-
86
-
87
-
88
-
89
-
90
-
91
-
92
-
93
-
94
-
95
-
96
-
97
-
98
-
99
-
100
-
101
-
102
-
103
-
104
-
105
-
106
-
107
-
108
-
109
-
110
-
111
-
112
-
113
-
114
-
115
-
116
-
117
-
118
-
119
-
120
-
121
-
122
-
123
-
124
-
125
-
126
-
127
-
128
-
129
-
130
-
131
-
132
-
 133
133 -
 134
134 -
 135
135 -
 136
136 -
 137
137 -
 138
138 -
 139
139 -
 140
140 -
 141
141 -
 142
142 -
 143
143 -
 144
144 -
 145
145 -
 146
146 -
 147
147 -
 148
148 -
 149
149 -
 150
150 -
 151
151 -
 152
152 -
 153
153 -
154
-
155
-
156
-
157
-
158
-
159
-
160
-
161
-
162
-
163
-
164
-
165
-
166
-
167
-
168
-
169
-
170
-
171
-
172
-
173
-
174
-
175
-
176
-
177
-
178
-
179
-
180
-
181
-
182
-
183
-
184
-
185
-
186
-
187
-
188
-
189
-
190
-
191
-
192
-
193
-
194
-
195
-
196
-
197
-
198
-
199
-
200
-
201
-
202
-
203
-
204
-
205
-
206
-
207
-
208
-
209
-
210
-
211
-
212
-
213
-
214
-
215
-
216
-
217
-
218
-
219
-
220
-
221
-
222
-
223
-
224
-
225
-
226
-
227
-
228
-
229
-
230
-
231
-
232
-
233
-
234
-
235
-
236
-
237
-
238
-
239
-
240
-
241
-
242
-
243
-
244
-
245
-
246
-
247
-
248
-
249
-
250
-
251
-
252
-
253
-
254
-
255
-
256
-
257
-
258
-
259
-
260
-
261
-
262
-
263
-
264
-
265
-
266
-
267
-
268
-
269
-
270
-
271
-
272
-
273
-
274
-
275
-
276
-
277
-
278
-
279
-
280
-
281
-
282
-
283
-
284
-
285
-
286
-
287
-
288
-
289
-
290
-
291
-
292
-
293
-
294
-
295
-
296
-
297
-
298
-
299
-
300
-
301
-
302
-
303
-
304
-
305
-
306
-
307
-
308
-
309
-
310
-
311
-
312
-
313
-
314
-
315
-
316
-
317
-
318
-
319
-
320
-
321
-
322
-
323
-
324
-
325
-
326
-
327
-
328
-
329
-
330
-
331
-
332
-
333
-
334
-
335
-
336
-
337
-
338
-
339
-
340
-
341
-
342
-
343
-
344
-
345
-
346
-
347
-
348
-
349
-
350
-
351
-
352
-
353
-
354
-
355
-
356
-
357
-
358
-
359
-
360
-
361
-
362
-
363
-
364
-
365
-
366
-
367
-
368
-
369
-
370
-
371
-
372
-
373
-
374
-
375
-
376
-
377
-
378
-
379
-
380
-
381
-
382
-
383
-
384
-
385
-
386
-
387
-
388
-
389
-
390
-
391
-
392
-
393
-
394
-
395
-
396
-
397
-
398
-
399
-
400
-
401
-
402
-
403
-
404
-
405
-
406
-
407
-
408
-
409
-
410
-
411
-
412
-
413
-
414
-
415
-
416
-
417
-
418
-
419
-
420
-
421
-
422
-
423
-
424
-
425
-
426
-
427
-
428
-
429
-
430
-
431
-
432
-
433
-
434
-
435
-
436
-
437
-
438
-
439
-
440
-
441
-
442
-
443
-
444
-
445
-
446
-
447
-
448
-
449
-
450
-
451
-
452
-
453
-
454
-
455
-
456
-
457
-
458
-
459
-
460
-
461
-
462
-
463
-
464
-
465
-
466
-
467
-
468
-
469
-
470
-
471
-
472
 |
 |

141
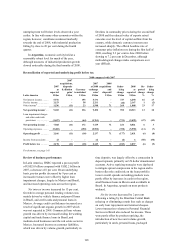
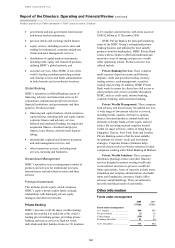
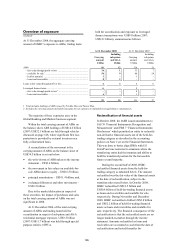
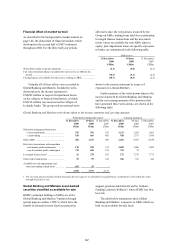
At 31 December
2008 2007
US$bn US$bn
Funds under management by
business
Global Asset Management ........ 370 380
Private Banking ......................... 219 275
Affiliates .................................... 2 3
Other .......................................... 144 186
735 844
Funds under management at 31 December 2008
were US$735 billion, a decrease of 13 per cent
compared with 31 December 2007. Both Global
Asset Management and Private Banking funds
decreased due to the fall in equity markets.
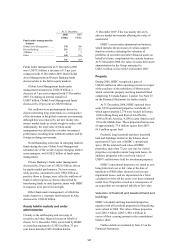
Global Asset Management funds under
management amounted to US$370 billion, a
decrease of 3 per cent compared with 31 December
2007. Excluding an internal transfer of
US$67 billion, Global Asset Management funds
decreased by 20 per cent to US$303 billion.
Net outflows were predominantly driven by
clients redeeming long-term funds as a consequence
of the downturn in the global economic environment,
although this was reduced by net new money into
money market funds as clients sought to reduce risk.
Additionally, the total value of funds under
management was affected by a weaker investment
performance resulting from turbulent markets and by
foreign exchange movements.
Notwithstanding a decrease in emerging markets
funds during the year, Global Asset Management
remained one of the world’s largest emerging market
asset managers, with US$52 billion of funds under
management.
Private Banking’s funds under management
decreased by 20 per cent to US$219 billion, driven
by equity market performance. Net new money,
while positive, amounted to only US$2 billion as
positive flows in Europe, were offset by outflows of
funds in other regions as clients reduced risk by
transferring funds to cash deposits, many with HSBC
in response to its perceived strength.
Other funds under management, of which the
main element is a corporate trust business in Asia,
decreased to US$144 billion.
Assets held in custody and under
administration
Custody is the safekeeping and servicing of
securities and other financial assets on behalf of
clients. At 31 December 2008, assets held by HSBC
as custodian amounted to US$3.6 trillion, 33 per
cent lower than the US$5.4 trillion held at
31 December 2007. This was mainly driven by
adverse market movements affecting the value of
assets held.
HSBC’s assets under administration business,
which includes the provision of various support
function activities including the valuation of
portfolios of securities and other financial assets on
behalf of clients, complements the custody business.
At 31 December 2008, the value of assets held under
administration by the Group amounted to
US$3.3 trillion, in line with 31 December 2007.
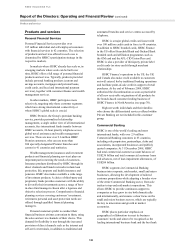
Property
During 2008, HSBC recognised a gain of
US$416 million in other operating income in respect
of the purchase of the subsidiary of Metrovacesa
which owned the property and long leasehold land
comprising 8 Canada Square, London. See Note 23
on the Financial Statements for further details.
At 31 December 2008, HSBC operated from
some 9,870 operational properties worldwide, of
which approximately 2,770 were located in Europe,
1,090 in Hong Kong and Rest of Asia-Pacific,
1,640 in North America, 4,200 in Latin America and
170 in the Middle East. These properties had an area
of approximately 73.6 million square feet (2007:
69.8 million square feet).
Freehold, long leasehold and short leasehold
land and buildings carried on the balance sheet
represented 35 per cent of HSBC’s operational
space. Of the total net book value of HSBC
properties, more than 72 per cent was for owned
properties or properties under long-term leases. In
addition, properties with a net book value of
US$971 million were held for investment purposes.
HSBC’s operational properties are stated at cost,
being historical cost or fair value at the date of
transition to IFRSs (their deemed cost) less any
impairment losses, and are depreciated on a basis
calculated to write off the assets over their estimated
useful lives. Properties owned as a consequence of
an acquisition are recognised initially at fair value.
Valuation of freehold and leasehold land and
buildings
HSBC’s freehold and long leasehold properties,
together with all leasehold properties in Hong Kong,
were valued in 2008. The value of these properties
was US$3.3 billion (2007: US$2.2 billion) in
excess of their carrying amount in the consolidated
balance sheet.
Further details are included in Note 23 on the
Financial Statements.