HSBC 2008 Annual Report Download - page 21
Download and view the complete annual report
Please find page 21 of the 2008 HSBC annual report below. You can navigate through the pages in the report by either clicking on the pages listed below, or by using the keyword search tool below to find specific information within the annual report.-
 1
1 -
2
-
3
-
4
-
5
-
6
-
7
-
8
-
9
-
10
-
 11
11 -
 12
12 -
 13
13 -
 14
14 -
 15
15 -
 16
16 -
 17
17 -
 18
18 -
 19
19 -
 20
20 -
 21
21 -
 22
22 -
 23
23 -
 24
24 -
 25
25 -
 26
26 -
 27
27 -
 28
28 -
 29
29 -
 30
30 -
 31
31 -
32
-
33
-
34
-
35
-
36
-
37
-
38
-
39
-
40
-
41
-
42
-
43
-
44
-
45
-
46
-
47
-
48
-
49
-
50
-
51
-
52
-
53
-
54
-
55
-
56
-
57
-
58
-
59
-
60
-
61
-
62
-
63
-
64
-
65
-
66
-
67
-
68
-
69
-
70
-
71
-
72
-
73
-
74
-
75
-
76
-
77
-
78
-
79
-
80
-
81
-
82
-
83
-
84
-
85
-
86
-
87
-
88
-
89
-
90
-
91
-
92
-
93
-
94
-
95
-
96
-
97
-
98
-
99
-
100
-
101
-
102
-
103
-
104
-
105
-
106
-
107
-
108
-
109
-
110
-
111
-
112
-
113
-
114
-
115
-
116
-
117
-
118
-
119
-
120
-
121
-
122
-
123
-
124
-
125
-
126
-
127
-
128
-
129
-
130
-
131
-
132
-
133
-
134
-
135
-
136
-
137
-
138
-
139
-
140
-
141
-
142
-
143
-
144
-
145
-
146
-
147
-
148
-
149
-
150
-
151
-
152
-
153
-
154
-
155
-
156
-
157
-
158
-
159
-
160
-
161
-
162
-
163
-
164
-
165
-
166
-
167
-
168
-
169
-
170
-
171
-
172
-
173
-
174
-
175
-
176
-
177
-
178
-
179
-
180
-
181
-
182
-
183
-
184
-
185
-
186
-
187
-
188
-
189
-
190
-
191
-
192
-
193
-
194
-
195
-
196
-
197
-
198
-
199
-
200
-
201
-
202
-
203
-
204
-
205
-
206
-
207
-
208
-
209
-
210
-
211
-
212
-
213
-
214
-
215
-
216
-
217
-
218
-
219
-
220
-
221
-
222
-
223
-
224
-
225
-
226
-
227
-
228
-
229
-
230
-
231
-
232
-
233
-
234
-
235
-
236
-
237
-
238
-
239
-
240
-
241
-
242
-
243
-
244
-
245
-
246
-
247
-
248
-
249
-
250
-
251
-
252
-
253
-
254
-
255
-
256
-
257
-
258
-
259
-
260
-
261
-
262
-
263
-
264
-
265
-
266
-
267
-
268
-
269
-
270
-
271
-
272
-
273
-
274
-
275
-
276
-
277
-
278
-
279
-
280
-
281
-
282
-
283
-
284
-
285
-
286
-
287
-
288
-
289
-
290
-
291
-
292
-
293
-
294
-
295
-
296
-
297
-
298
-
299
-
300
-
301
-
302
-
303
-
304
-
305
-
306
-
307
-
308
-
309
-
310
-
311
-
312
-
313
-
314
-
315
-
316
-
317
-
318
-
319
-
320
-
321
-
322
-
323
-
324
-
325
-
326
-
327
-
328
-
329
-
330
-
331
-
332
-
333
-
334
-
335
-
336
-
337
-
338
-
339
-
340
-
341
-
342
-
343
-
344
-
345
-
346
-
347
-
348
-
349
-
350
-
351
-
352
-
353
-
354
-
355
-
356
-
357
-
358
-
359
-
360
-
361
-
362
-
363
-
364
-
365
-
366
-
367
-
368
-
369
-
370
-
371
-
372
-
373
-
374
-
375
-
376
-
377
-
378
-
379
-
380
-
381
-
382
-
383
-
384
-
385
-
386
-
387
-
388
-
389
-
390
-
391
-
392
-
393
-
394
-
395
-
396
-
397
-
398
-
399
-
400
-
401
-
402
-
403
-
404
-
405
-
406
-
407
-
408
-
409
-
410
-
411
-
412
-
413
-
414
-
415
-
416
-
417
-
418
-
419
-
420
-
421
-
422
-
423
-
424
-
425
-
426
-
427
-
428
-
429
-
430
-
431
-
432
-
433
-
434
-
435
-
436
-
437
-
438
-
439
-
440
-
441
-
442
-
443
-
444
-
445
-
446
-
447
-
448
-
449
-
450
-
451
-
452
-
453
-
454
-
455
-
456
-
457
-
458
-
459
-
460
-
461
-
462
-
463
-
464
-
465
-
466
-
467
-
468
-
469
-
470
-
471
-
472
 |
 |
19
charges rose at a faster rate than income on higher
average risk-weighted assets.
Return on average invested capital measures
the return on the capital investment made in the
business, enabling management to benchmark HSBC
against competitors. In 2008, the ratio of 4.0 per cent
was 11.3 percentage points lower than that reported
in 2007. This decrease reflected the decline in profit
driven by goodwill impairment, the significant
increase in loan impairment charges, write-downs in
credit trading, leveraged and acquisition finance, and
monoline exposures. The comparative period
included dilution gains which were not repeated.
HSBC aims to deliver sustained dividend per
share growth for its shareholders. The total dividend
for 2008, based on the year to which the dividends
relate (rather than when they were paid), amounts to
US$0.64, a reduction of 28.9 per cent on 2007,
reflecting the decline in profitability, prevailing
business conditions and capital requirements. This
basis differs from the disclosure in the five-year
comparison on page 4.
Basic earnings per share (‘EPS’) is a ratio that
shows the level of earnings generated per ordinary
share. EPS is one of two KPIs used in rewarding
employees and is discussed in more detail in the
Director’s Remuneration Report on page 315. EPS
for 2008 was US$0.47, a decline of 71.5 per cent on
2007. This, in part, reflected the effect of recognising
goodwill impairment in North America as well as the
broad based impact of the global economic crisis.
Excluding the goodwill impairment, EPS would
have been US$1.36, a decline of 17.6 per cent over
2007 and in line with that delivered in 2005 and
2006. In 2007, EPS grew by 17.9 per cent over that
reported in 2006.
Return on average total shareholders’ equity
measures the return on average shareholders’
investment in the business. This enables
management to benchmark Group performance
against competitors and its own targets. In 2008, the
ratio was 4.7 per cent or 11.2 percentage points
lower than in 2007 of which 8.6 percentage points
related to the goodwill impairment recognised. This
absolute performance is not regarded as satisfactory,
being lower than management’s target range of
between 15 and 19 per cent.
Total shareholder return (‘TSR’) is used
as a method of assessing the overall return to
shareholders on their investment in HSBC, and is
defined as the growth in share value and declared
dividend income during the relevant period. TSR is a
key performance measure in rewarding employees.
In calculating TSR, dividend income is assumed to
be invested in the underlying shares. The TSR
benchmark is an index set at 100 and measured over
one, three and five years for the purpose of
comparison with the performance of a group of
competitor banks which reflect HSBC’s range and
breadth of activities. As the comparator group
includes companies listed on overseas markets, a
common currency is used to ensure that TSR is
measured on a consistent basis. The TSR levels at
the end of 2008 were 84.5, 84.5, and 98.5 over one,
three and five years respectively. HSBC’s TSR over
all periods, while disappointing in absolute terms,
has significantly outperformed the peer group as the
current financial crisis has had a significantly more
adverse impact on their performance and rating.
Management believes that financial KPIs must
remain relevant to the business so they may be
changed over time to reflect changes in the Group’s
composition and the strategies employed.
Non-financial KPIs
HSBC has chosen four non-financial KPIs which are
important to the future success of the Group in
delivering its strategic objectives. These non-
financial KPIs are currently reported internally
within HSBC on a local basis.
Employee engagement
Employee engagement is a measure of employees’
emotional and rational attachment to HSBC. It is
critical to the long-term success of the Group and, as
such, an employee engagement target was included
in the 2008 objectives for Group Executives (see
Directors’ Remuneration Report, page 315).
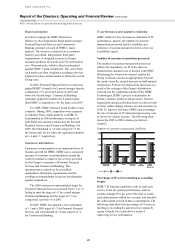
In 2008, HSBC conducted its second Global
People Survey of HSBC’s permanent workforce
worldwide. The 2008 participation rate of 93 per
cent improved on the 2007 figure of 88 per cent,
which was already around the highest in the industry.
The Group’s employee engagement score rose
from 60 per cent in 2007 to 67 per cent in 2008. In
achieving 67 per cent, HSBC exceeded its target for
2008 of 62 per cent, the external global norm and the
sector norm. Its 2009 target is 69 per cent.
The 2008 survey covered 13 dimensions which
included assessing for the first time whether action
had been perceived to have been taken on the results
of the 2007 survey. Employees rated HSBC above
the external global norm across all dimensions.
HSBC exceeded the external best-in-class norm for
Corporate Sustainability, and the dimensions
covering Strategy and Vision, Reputation, Direct
Manager and Leadership were close to this norm.