HSBC 2008 Annual Report Download - page 205
Download and view the complete annual report
Please find page 205 of the 2008 HSBC annual report below. You can navigate through the pages in the report by either clicking on the pages listed below, or by using the keyword search tool below to find specific information within the annual report.-
 1
1 -
 2
2 -
 3
3 -
 4
4 -
 5
5 -
 6
6 -
 7
7 -
 8
8 -
 9
9 -
 10
10 -
 11
11 -
 12
12 -
 13
13 -
 14
14 -
 15
15 -
 16
16 -
 17
17 -
 18
18 -
 19
19 -
 20
20 -
 21
21 -
 22
22 -
 23
23 -
 24
24 -
 25
25 -
 26
26 -
 27
27 -
 28
28 -
 29
29 -
 30
30 -
 31
31 -
 32
32 -
 33
33 -
 34
34 -
 35
35 -
 36
36 -
 37
37 -
 38
38 -
 39
39 -
 40
40 -
 41
41 -
 42
42 -
 43
43 -
 44
44 -
 45
45 -
 46
46 -
 47
47 -
 48
48 -
 49
49 -
 50
50 -
 51
51 -
 52
52 -
 53
53 -
 54
54 -
 55
55 -
 56
56 -
 57
57 -
 58
58 -
 59
59 -
 60
60 -
 61
61 -
 62
62 -
 63
63 -
 64
64 -
 65
65 -
 66
66 -
 67
67 -
 68
68 -
 69
69 -
 70
70 -
 71
71 -
 72
72 -
 73
73 -
 74
74 -
 75
75 -
 76
76 -
 77
77 -
 78
78 -
 79
79 -
 80
80 -
 81
81 -
 82
82 -
 83
83 -
 84
84 -
 85
85 -
 86
86 -
 87
87 -
 88
88 -
 89
89 -
 90
90 -
 91
91 -
 92
92 -
 93
93 -
 94
94 -
 95
95 -
 96
96 -
 97
97 -
 98
98 -
 99
99 -
 100
100 -
 101
101 -
 102
102 -
 103
103 -
 104
104 -
 105
105 -
 106
106 -
 107
107 -
 108
108 -
 109
109 -
 110
110 -
 111
111 -
 112
112 -
 113
113 -
 114
114 -
 115
115 -
 116
116 -
 117
117 -
 118
118 -
 119
119 -
 120
120 -
 121
121 -
 122
122 -
 123
123 -
 124
124 -
 125
125 -
 126
126 -
 127
127 -
 128
128 -
 129
129 -
 130
130 -
 131
131 -
 132
132 -
 133
133 -
 134
134 -
 135
135 -
 136
136 -
 137
137 -
 138
138 -
 139
139 -
 140
140 -
 141
141 -
 142
142 -
 143
143 -
 144
144 -
 145
145 -
 146
146 -
 147
147 -
 148
148 -
 149
149 -
 150
150 -
 151
151 -
 152
152 -
 153
153 -
 154
154 -
 155
155 -
 156
156 -
 157
157 -
 158
158 -
 159
159 -
 160
160 -
 161
161 -
 162
162 -
 163
163 -
 164
164 -
 165
165 -
 166
166 -
 167
167 -
 168
168 -
 169
169 -
 170
170 -
 171
171 -
 172
172 -
 173
173 -
 174
174 -
 175
175 -
 176
176 -
 177
177 -
 178
178 -
 179
179 -
 180
180 -
 181
181 -
 182
182 -
 183
183 -
 184
184 -
 185
185 -
 186
186 -
 187
187 -
 188
188 -
 189
189 -
 190
190 -
 191
191 -
 192
192 -
 193
193 -
 194
194 -
 195
195 -
 196
196 -
 197
197 -
 198
198 -
 199
199 -
 200
200 -
 201
201 -
 202
202 -
 203
203 -
 204
204 -
 205
205 -
 206
206 -
 207
207 -
 208
208 -
 209
209 -
 210
210 -
 211
211 -
 212
212 -
 213
213 -
 214
214 -
 215
215 -
 216
216 -
 217
217 -
 218
218 -
 219
219 -
 220
220 -
 221
221 -
 222
222 -
 223
223 -
 224
224 -
 225
225 -
 226
226 -
 227
227 -
 228
228 -
 229
229 -
 230
230 -
 231
231 -
 232
232 -
 233
233 -
 234
234 -
 235
235 -
 236
236 -
 237
237 -
 238
238 -
 239
239 -
 240
240 -
 241
241 -
 242
242 -
 243
243 -
 244
244 -
 245
245 -
 246
246 -
 247
247 -
 248
248 -
 249
249 -
 250
250 -
 251
251 -
 252
252 -
 253
253 -
 254
254 -
 255
255 -
 256
256 -
 257
257 -
 258
258 -
 259
259 -
 260
260 -
 261
261 -
 262
262 -
 263
263 -
 264
264 -
 265
265 -
 266
266 -
 267
267 -
 268
268 -
 269
269 -
 270
270 -
 271
271 -
 272
272 -
 273
273 -
 274
274 -
 275
275 -
 276
276 -
 277
277 -
 278
278 -
 279
279 -
 280
280 -
 281
281 -
 282
282 -
 283
283 -
 284
284 -
 285
285 -
 286
286 -
 287
287 -
 288
288 -
 289
289 -
 290
290 -
 291
291 -
 292
292 -
 293
293 -
 294
294 -
 295
295 -
 296
296 -
 297
297 -
 298
298 -
 299
299 -
 300
300 -
 301
301 -
 302
302 -
 303
303 -
 304
304 -
 305
305 -
 306
306 -
 307
307 -
 308
308 -
 309
309 -
 310
310 -
 311
311 -
 312
312 -
 313
313 -
 314
314 -
 315
315 -
 316
316 -
 317
317 -
 318
318 -
 319
319 -
 320
320 -
 321
321 -
 322
322 -
 323
323 -
 324
324 -
 325
325 -
 326
326 -
 327
327 -
 328
328 -
 329
329 -
 330
330 -
 331
331 -
 332
332 -
 333
333 -
 334
334 -
 335
335 -
 336
336 -
 337
337 -
 338
338 -
 339
339 -
 340
340 -
 341
341 -
 342
342 -
 343
343 -
 344
344 -
 345
345 -
 346
346 -
 347
347 -
 348
348 -
 349
349 -
 350
350 -
 351
351 -
 352
352 -
 353
353 -
 354
354 -
 355
355 -
 356
356 -
 357
357 -
 358
358 -
 359
359 -
 360
360 -
 361
361 -
 362
362 -
 363
363 -
 364
364 -
 365
365 -
 366
366 -
 367
367 -
 368
368 -
 369
369 -
 370
370 -
 371
371 -
 372
372 -
 373
373 -
 374
374 -
 375
375 -
 376
376 -
 377
377 -
 378
378 -
 379
379 -
 380
380 -
 381
381 -
 382
382 -
 383
383 -
 384
384 -
 385
385 -
 386
386 -
 387
387 -
 388
388 -
 389
389 -
 390
390 -
 391
391 -
 392
392 -
 393
393 -
 394
394 -
 395
395 -
 396
396 -
 397
397 -
 398
398 -
 399
399 -
 400
400 -
 401
401 -
 402
402 -
 403
403 -
 404
404 -
 405
405 -
 406
406 -
 407
407 -
 408
408 -
 409
409 -
 410
410 -
 411
411 -
 412
412 -
 413
413 -
 414
414 -
 415
415 -
 416
416 -
 417
417 -
 418
418 -
 419
419 -
 420
420 -
 421
421 -
 422
422 -
 423
423 -
 424
424 -
 425
425 -
 426
426 -
 427
427 -
 428
428 -
 429
429 -
 430
430 -
 431
431 -
 432
432 -
 433
433 -
 434
434 -
 435
435 -
 436
436 -
 437
437 -
 438
438 -
 439
439 -
 440
440 -
 441
441 -
 442
442 -
 443
443 -
 444
444 -
 445
445 -
 446
446 -
 447
447 -
 448
448 -
 449
449 -
 450
450 -
 451
451 -
 452
452 -
 453
453 -
 454
454 -
 455
455 -
 456
456 -
 457
457 -
 458
458 -
 459
459 -
 460
460 -
 461
461 -
 462
462 -
 463
463 -
 464
464 -
 465
465 -
 466
466 -
 467
467 -
 468
468 -
 469
469 -
 470
470 -
 471
471 -
 472
472
 |
 |
203
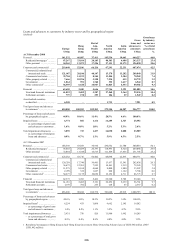
21 per cent of total loans and advances to customers
(including the financial sector and settlement
accounts).
In Europe, other personal lending declined
by 11 per cent from the end of 2007 to
US$54 billion. The decrease was primarily
attributable to the UK as a stronger focus on secured
lending restricted originations in the unsecured
portfolio. The sale of certain non-core credit card
portfolios in the first half of 2008 also contributed to
the decrease in the UK. In France, balances declined
due to the sale of the regional banks in the second
half of 2008. In Turkey, continued expansion of the
branch network during 2008 resulted in higher
balances, particularly in credit cards and overdrafts.
In Hong Kong, other personal lending declined
by 2 per cent to US$13 billion. HSBC remained the
market leader for credit cards in Hong Kong based
on cards in circulation, cardholder spending and
balances.
In Rest of Asia-Pacific, other personal lending
rose by 12 per cent, primarily due to strong growth
in the Middle East. Elsewhere in the region, balances
rose in Malaysia and Indonesia.
In North America, other personal lending
balances declined by 12 per cent to US$97 billion. In
the US, consumer finance business and credit card
lending fell due to the combined effect of tighter
underwriting criteria and lower marketing
expenditure. A reduction in non-credit card personal
lending reflected the decision to cease new business
in guaranteed direct mail loans and personal home-
owner loans in the second half of 2007, and tighter
underwriting criteria applied to originations in the
remainder of the portfolio. In the mortgage services
business, second lien balances declined due to the
continued run-off of the portfolio following the
cessation of originations in 2007. Lower vehicle
finance lending at HSBC Finance reflected the
discontinuation of certain product offerings and the
cessation of new vehicle loan originations from the
dealer and direct-to-consumer channels in July 2008.
HSBC USA also discontinued originations of
indirect vehicle finance loans, but second lien loans
increased following a promotional campaign
channelled through the branch network in the first
half of 2008. In Canada, lower balances were
attributable to the disposal of the vehicle finance
businesses during the year.
In Latin America, other personal lending rose by
9 per cent to US$15 billion. Lending growth was
primarily concentrated in Brazil and reflected strong
demand for payroll loans and vehicle lending. In
Mexico, balances were broadly in line with
31 December 2007 and the mix was adjusted
towards customers of higher credit quality. Further
growth was restricted as risk appetite was adjusted
by closing certain products to new originations and
tightening underwriting criteria on cards, leading to a
sharp reduction in the number of cards issued in
2008.
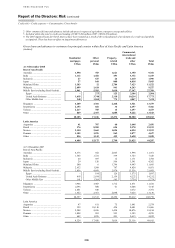
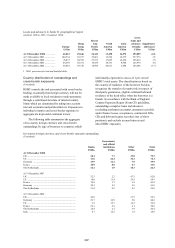
Loans and advances to corporate and
commercial customers rose by 19 per cent to
US$407 billion, with strong growth across all
regions. Lending was primarily concentrated in
Europe, where it accounted for 54 per cent of
advances to this sector, of which more than
40 per cent were in the UK.
In Europe, corporate and commercial advances
rose by 24 per cent. In the UK, lending rose by
35 per cent, driven by growth in lending to large
corporates. Balances declined in France due to the
sale of the regional banks in July 2008.
In Hong Kong, corporate and commercial
lending rose by 19 per cent, driven by higher lending
in commercial, industrial and international trade,
commercial real estate and other property-related
sectors.
In Rest of Asia-Pacific, strong corporate and
commercial lending growth was experienced in the
Middle East and Singapore, which rose by 26 per
cent and 50 per cent respectively and, to a lesser
extent, in Malaysia, India and Taiwan, the latter due
to the acquisition of the assets and liabilities of The
Chinese Bank in March 2008. In the Middle East,
the corporate and commercial loan book continued
to grow, owing to an expansion of lending in UAE,
particularly for trade and investment projects, in
addition to general business growth. In Singapore,
higher lending was driven by strong demand from
the international trade sector. Lending in Japan
declined due to the closure of inactive and
unprofitable accounts, and lending in mainland
China fell as a result of tightened government
regulations and tighter lending criteria in response to
the weakening local economy. This partly offset the
strong growth elsewhere in the region.
In North America, corporate and commercial
lending increased by 7 per cent, driven by growth in
HSBC USA and, to a lesser extent, in Canada.
In HSBC USA, higher lending to corporate and
commercial clients reflected the targeted expansion
of middle market activities and the drawdown of
existing credit facilities, partly offset by a decline in
commercial real estate activity as the bank managed
down its lending exposures in light of lower risk
appetite and a deterioration in market conditions. In
Canada, corporate and commercial lending rose by
