HSBC 2008 Annual Report Download - page 101
Download and view the complete annual report
Please find page 101 of the 2008 HSBC annual report below. You can navigate through the pages in the report by either clicking on the pages listed below, or by using the keyword search tool below to find specific information within the annual report.-
 1
1 -
2
-
3
-
4
-
5
-
6
-
7
-
8
-
9
-
10
-
11
-
12
-
13
-
14
-
15
-
16
-
17
-
18
-
19
-
20
-
21
-
22
-
23
-
24
-
25
-
26
-
27
-
28
-
29
-
30
-
31
-
32
-
33
-
34
-
35
-
36
-
37
-
38
-
39
-
40
-
41
-
42
-
43
-
44
-
45
-
46
-
47
-
48
-
49
-
50
-
51
-
52
-
53
-
54
-
55
-
56
-
57
-
58
-
59
-
60
-
61
-
62
-
63
-
64
-
65
-
66
-
67
-
68
-
69
-
70
-
71
-
72
-
73
-
74
-
75
-
76
-
77
-
78
-
79
-
80
-
81
-
82
-
83
-
84
-
85
-
86
-
87
-
88
-
89
-
90
-
 91
91 -
 92
92 -
 93
93 -
 94
94 -
 95
95 -
 96
96 -
 97
97 -
 98
98 -
 99
99 -
 100
100 -
 101
101 -
 102
102 -
 103
103 -
 104
104 -
 105
105 -
 106
106 -
 107
107 -
 108
108 -
 109
109 -
 110
110 -
 111
111 -
112
-
113
-
114
-
115
-
116
-
117
-
118
-
119
-
120
-
121
-
122
-
123
-
124
-
125
-
126
-
127
-
128
-
129
-
130
-
131
-
132
-
133
-
134
-
135
-
136
-
137
-
138
-
139
-
140
-
141
-
142
-
143
-
144
-
145
-
146
-
147
-
148
-
149
-
150
-
151
-
152
-
153
-
154
-
155
-
156
-
157
-
158
-
159
-
160
-
161
-
162
-
163
-
164
-
165
-
166
-
167
-
168
-
169
-
170
-
171
-
172
-
173
-
174
-
175
-
176
-
177
-
178
-
179
-
180
-
181
-
182
-
183
-
184
-
185
-
186
-
187
-
188
-
189
-
190
-
191
-
192
-
193
-
194
-
195
-
196
-
197
-
198
-
199
-
200
-
201
-
202
-
203
-
204
-
205
-
206
-
207
-
208
-
209
-
210
-
211
-
212
-
213
-
214
-
215
-
216
-
217
-
218
-
219
-
220
-
221
-
222
-
223
-
224
-
225
-
226
-
227
-
228
-
229
-
230
-
231
-
232
-
233
-
234
-
235
-
236
-
237
-
238
-
239
-
240
-
241
-
242
-
243
-
244
-
245
-
246
-
247
-
248
-
249
-
250
-
251
-
252
-
253
-
254
-
255
-
256
-
257
-
258
-
259
-
260
-
261
-
262
-
263
-
264
-
265
-
266
-
267
-
268
-
269
-
270
-
271
-
272
-
273
-
274
-
275
-
276
-
277
-
278
-
279
-
280
-
281
-
282
-
283
-
284
-
285
-
286
-
287
-
288
-
289
-
290
-
291
-
292
-
293
-
294
-
295
-
296
-
297
-
298
-
299
-
300
-
301
-
302
-
303
-
304
-
305
-
306
-
307
-
308
-
309
-
310
-
311
-
312
-
313
-
314
-
315
-
316
-
317
-
318
-
319
-
320
-
321
-
322
-
323
-
324
-
325
-
326
-
327
-
328
-
329
-
330
-
331
-
332
-
333
-
334
-
335
-
336
-
337
-
338
-
339
-
340
-
341
-
342
-
343
-
344
-
345
-
346
-
347
-
348
-
349
-
350
-
351
-
352
-
353
-
354
-
355
-
356
-
357
-
358
-
359
-
360
-
361
-
362
-
363
-
364
-
365
-
366
-
367
-
368
-
369
-
370
-
371
-
372
-
373
-
374
-
375
-
376
-
377
-
378
-
379
-
380
-
381
-
382
-
383
-
384
-
385
-
386
-
387
-
388
-
389
-
390
-
391
-
392
-
393
-
394
-
395
-
396
-
397
-
398
-
399
-
400
-
401
-
402
-
403
-
404
-
405
-
406
-
407
-
408
-
409
-
410
-
411
-
412
-
413
-
414
-
415
-
416
-
417
-
418
-
419
-
420
-
421
-
422
-
423
-
424
-
425
-
426
-
427
-
428
-
429
-
430
-
431
-
432
-
433
-
434
-
435
-
436
-
437
-
438
-
439
-
440
-
441
-
442
-
443
-
444
-
445
-
446
-
447
-
448
-
449
-
450
-
451
-
452
-
453
-
454
-
455
-
456
-
457
-
458
-
459
-
460
-
461
-
462
-
463
-
464
-
465
-
466
-
467
-
468
-
469
-
470
-
471
-
472
 |
 |

99
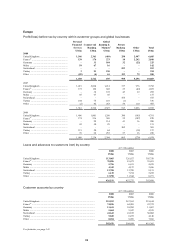
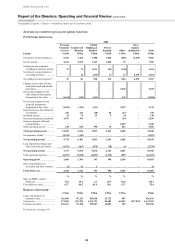
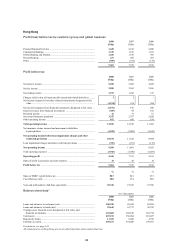
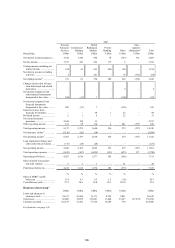
Hong Kong
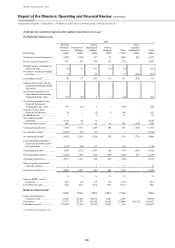
Profit/(loss) before tax by customer group and global business
2008
US$m
2007
US$m
2006
US$m
Personal Financial Services ............................................................................. 3,428 4,212 2,880
Commercial Banking ....................................................................................... 1,315 1,619 1,321
Global Banking and Markets ........................................................................... 1,436 1,578 955
Private Banking ............................................................................................... 237 305 201
Other ................................................................................................................ (955) (375) (175)
5,461 7,339 5,182
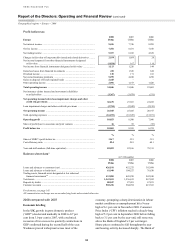
Profit before tax
2008
US$m
2007
US$m
2006
US$m
Net interest income .......................................................................................... 5,698 5,483 4,685
Net fee income ................................................................................................. 2,580 3,362 2,056
Net trading income .......................................................................................... 1,193 1,242 617
Changes in fair value of long-term debt issued and related derivatives ......... 32 –
Net income/(expense) from other financial instruments designated at fair
value ............................................................................................................ (1,194) 674 260
Net income/(expense) from financial instruments designated at fair value ... (1,191) 676 260
Gains less losses from financial investments .................................................. (309) 94 162
Dividend income .............................................................................................. 41 31 61
Net earned insurance premiums ...................................................................... 3,247 2,797 2,628
Other operating income ................................................................................... 817 845 834
Total operating income ................................................................................. 12,076 14,530 11,303
Net insurance claims incurred and movement in liabilities
to policyholders ........................................................................................... (1,922) (3,208) (2,699)
Net operating income before loan impairment charges and other
credit risk provisions ................................................................................. 10,154 11,322 8,604
Loan impairment charges and other credit risk provisions ............................. (765) (231) (172)
Net operating income .................................................................................... 9,389 11,091 8,432
Total operating expenses ................................................................................. (3,943) (3,780) (3,269)
Operating profit ............................................................................................. 5,446 7,311 5,163
Share of profit in associates and joint ventures ............................................... 15 28 19
Profit before tax ............................................................................................. 5,461 7,339 5,182
% % %
Share of HSBC’s profit before tax .................................................................. 58.7 30.3 23.5
Cost efficiency ratio ........................................................................................ 38.8 33.4 38.0
Year-end staff numbers (full-time equivalent) ................................................ 29,330 27,655 27,586
Balance sheet data15
At 31 December
2008 2007 2006
US$m US$m US$m
Loans and advances to customers (net) ........................................................... 100,220 89,638 84,282
Loans and advances to banks (net) .................................................................. 29,646 63,737 50,359
Trading assets, financial assets designated at fair value, and
financial investments ................................................................................... 122,602 102,180 103,734
Total assets ...................................................................................................... 407,151 356,894 318,857
Deposits by banks ............................................................................................ 11,769 6,420 4,799
Customer accounts ........................................................................................... 250,517 234,488 196,691
For footnote, see page 143.
All commentaries on Hong Kong are on an underlying basis unless stated otherwise.