HSBC 2008 Annual Report Download - page 149
Download and view the complete annual report
Please find page 149 of the 2008 HSBC annual report below. You can navigate through the pages in the report by either clicking on the pages listed below, or by using the keyword search tool below to find specific information within the annual report.-
 1
1 -
2
-
3
-
4
-
5
-
6
-
7
-
8
-
9
-
10
-
11
-
12
-
13
-
14
-
15
-
16
-
17
-
18
-
19
-
20
-
21
-
22
-
23
-
24
-
25
-
26
-
27
-
28
-
29
-
30
-
31
-
32
-
33
-
34
-
35
-
36
-
37
-
38
-
39
-
40
-
41
-
42
-
43
-
44
-
45
-
46
-
47
-
48
-
49
-
50
-
51
-
52
-
53
-
54
-
55
-
56
-
57
-
58
-
59
-
60
-
61
-
62
-
63
-
64
-
65
-
66
-
67
-
68
-
69
-
70
-
71
-
72
-
73
-
74
-
75
-
76
-
77
-
78
-
79
-
80
-
81
-
82
-
83
-
84
-
85
-
86
-
87
-
88
-
89
-
90
-
91
-
92
-
93
-
94
-
95
-
96
-
97
-
98
-
99
-
100
-
101
-
102
-
103
-
104
-
105
-
106
-
107
-
108
-
109
-
110
-
111
-
112
-
113
-
114
-
115
-
116
-
117
-
118
-
119
-
120
-
121
-
122
-
123
-
124
-
125
-
126
-
127
-
128
-
129
-
130
-
131
-
132
-
133
-
134
-
135
-
136
-
137
-
138
-
 139
139 -
 140
140 -
 141
141 -
 142
142 -
 143
143 -
 144
144 -
 145
145 -
 146
146 -
 147
147 -
 148
148 -
 149
149 -
 150
150 -
 151
151 -
 152
152 -
 153
153 -
 154
154 -
 155
155 -
 156
156 -
 157
157 -
 158
158 -
 159
159 -
160
-
161
-
162
-
163
-
164
-
165
-
166
-
167
-
168
-
169
-
170
-
171
-
172
-
173
-
174
-
175
-
176
-
177
-
178
-
179
-
180
-
181
-
182
-
183
-
184
-
185
-
186
-
187
-
188
-
189
-
190
-
191
-
192
-
193
-
194
-
195
-
196
-
197
-
198
-
199
-
200
-
201
-
202
-
203
-
204
-
205
-
206
-
207
-
208
-
209
-
210
-
211
-
212
-
213
-
214
-
215
-
216
-
217
-
218
-
219
-
220
-
221
-
222
-
223
-
224
-
225
-
226
-
227
-
228
-
229
-
230
-
231
-
232
-
233
-
234
-
235
-
236
-
237
-
238
-
239
-
240
-
241
-
242
-
243
-
244
-
245
-
246
-
247
-
248
-
249
-
250
-
251
-
252
-
253
-
254
-
255
-
256
-
257
-
258
-
259
-
260
-
261
-
262
-
263
-
264
-
265
-
266
-
267
-
268
-
269
-
270
-
271
-
272
-
273
-
274
-
275
-
276
-
277
-
278
-
279
-
280
-
281
-
282
-
283
-
284
-
285
-
286
-
287
-
288
-
289
-
290
-
291
-
292
-
293
-
294
-
295
-
296
-
297
-
298
-
299
-
300
-
301
-
302
-
303
-
304
-
305
-
306
-
307
-
308
-
309
-
310
-
311
-
312
-
313
-
314
-
315
-
316
-
317
-
318
-
319
-
320
-
321
-
322
-
323
-
324
-
325
-
326
-
327
-
328
-
329
-
330
-
331
-
332
-
333
-
334
-
335
-
336
-
337
-
338
-
339
-
340
-
341
-
342
-
343
-
344
-
345
-
346
-
347
-
348
-
349
-
350
-
351
-
352
-
353
-
354
-
355
-
356
-
357
-
358
-
359
-
360
-
361
-
362
-
363
-
364
-
365
-
366
-
367
-
368
-
369
-
370
-
371
-
372
-
373
-
374
-
375
-
376
-
377
-
378
-
379
-
380
-
381
-
382
-
383
-
384
-
385
-
386
-
387
-
388
-
389
-
390
-
391
-
392
-
393
-
394
-
395
-
396
-
397
-
398
-
399
-
400
-
401
-
402
-
403
-
404
-
405
-
406
-
407
-
408
-
409
-
410
-
411
-
412
-
413
-
414
-
415
-
416
-
417
-
418
-
419
-
420
-
421
-
422
-
423
-
424
-
425
-
426
-
427
-
428
-
429
-
430
-
431
-
432
-
433
-
434
-
435
-
436
-
437
-
438
-
439
-
440
-
441
-
442
-
443
-
444
-
445
-
446
-
447
-
448
-
449
-
450
-
451
-
452
-
453
-
454
-
455
-
456
-
457
-
458
-
459
-
460
-
461
-
462
-
463
-
464
-
465
-
466
-
467
-
468
-
469
-
470
-
471
-
472
 |
 |

147
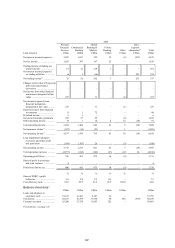
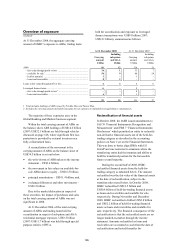
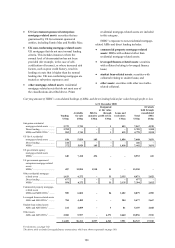
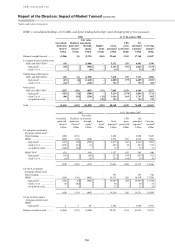
Financial effect of market turmoil
As described in the background to market turmoil on
page 144, the dislocation of financial markets which
developed in the second half of 2007 continued
throughout 2008. For the three half-year periods
affected to date, the write-downs incurred by the
Group on ABSs, trading loans held for securitisation,
leveraged finance transactions and the movement
in fair values on available-for-sale ABSs taken to
equity, plus impairment losses on specific exposures
to banks, are summarised in the following table:
Half-year to
31 December
2008
30 June
2008
31 December
2007
US$bn US$bn US$bn
Write-downs taken to income statement ......................................................... (2.3) (4.0) (2.3)
Fair value movement taken to available-for-sale reserve on ABSs in the
period ........................................................................................................... (10.4) (6.1) (2.2)
Closing balance of available-for-sale reserve relating to ABSs ..................... (18.7) (8.3) (2.2)
Virtually all of these effects were recorded in
Global Banking and Markets. Included in write-
downs taken to the income statement is
US$209 million in respect of impairment losses
on the collapse of financial institutions, of which
US$126 million was incurred on the collapse of
Icelandic banks. The group took no material write-
downs to the income statement in respect of
exposures to Lehman Brothers.
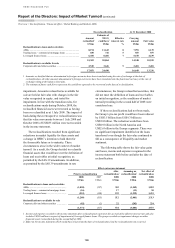
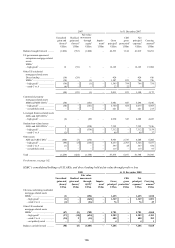
Further analysis of the write-downs taken to the
income statement by Global Banking and Markets,
and the net carrying amounts of the positions that
have generated these write-downs, are shown in the
following table:
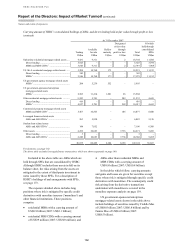
Global Banking and Markets write-downs taken to the income statement and carrying amounts
Write-downs during half-year to Carrying amount at
31 December
2008
30 June
2008
31 December
2007
31 December
2008
30 June
2008
31 December
2007
US$m US$m US$m US$m US$m US$m
Sub-prime mortgage-related assets
– loan securitisation ................................ 292 301 529 1,213 1,565 1,965
– credit trading ....................................... 150 665 463 428 1,377 1,700
Other ABSs ................................................. 486 1,327 459 2,201 8,923 9,830
Derivative transactions with monolines
– investment grade counterparts ............ 130 598 133 2,089 1,206 1,209
– non-investment grade counterparts ..... 370 608 214 352 78 –
Leveraged finance loans1 ............................ 26 278 195 271 7,375 7,772
Other credit related items ........................... 95 99 142 186 321 446
Available-for-sale impairments and
other non-trading related items .............. 655 55 –
2,204 3,931 2,135
1 The carrying amount includes funded loans plus the net exposure to unfunded leveraged finance commitments, held within fair value
through the profit or loss.
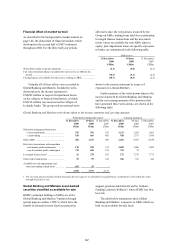
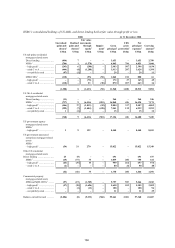
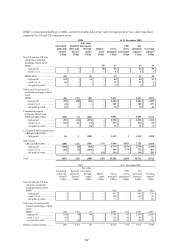
Global Banking and Markets asset-backed
securities classified as available for sale
HSBC’s principal holdings of ABSs are in the
Global Banking and Markets’ business through
special purpose entities (‘SPE’s) which have the
benefit of external investor first loss protection
support, positions held directly and by Solitaire
Funding Limited (‘Solitaire’) where HSBC has first
loss risk.
The table below summarises these Global
Banking and Markets’ exposures to ABSs which are
held on an available-for-sale basis.