HSBC 2008 Annual Report Download - page 79
Download and view the complete annual report
Please find page 79 of the 2008 HSBC annual report below. You can navigate through the pages in the report by either clicking on the pages listed below, or by using the keyword search tool below to find specific information within the annual report.-
 1
1 -
2
-
3
-
4
-
5
-
6
-
7
-
8
-
9
-
10
-
11
-
12
-
13
-
14
-
15
-
16
-
17
-
18
-
19
-
20
-
21
-
22
-
23
-
24
-
25
-
26
-
27
-
28
-
29
-
30
-
31
-
32
-
33
-
34
-
35
-
36
-
37
-
38
-
39
-
40
-
41
-
42
-
43
-
44
-
45
-
46
-
47
-
48
-
49
-
50
-
51
-
52
-
53
-
54
-
55
-
56
-
57
-
58
-
59
-
60
-
61
-
62
-
63
-
64
-
65
-
66
-
67
-
68
-
 69
69 -
 70
70 -
 71
71 -
 72
72 -
 73
73 -
 74
74 -
 75
75 -
 76
76 -
 77
77 -
 78
78 -
 79
79 -
 80
80 -
 81
81 -
 82
82 -
 83
83 -
 84
84 -
 85
85 -
 86
86 -
 87
87 -
 88
88 -
 89
89 -
90
-
91
-
92
-
93
-
94
-
95
-
96
-
97
-
98
-
99
-
100
-
101
-
102
-
103
-
104
-
105
-
106
-
107
-
108
-
109
-
110
-
111
-
112
-
113
-
114
-
115
-
116
-
117
-
118
-
119
-
120
-
121
-
122
-
123
-
124
-
125
-
126
-
127
-
128
-
129
-
130
-
131
-
132
-
133
-
134
-
135
-
136
-
137
-
138
-
139
-
140
-
141
-
142
-
143
-
144
-
145
-
146
-
147
-
148
-
149
-
150
-
151
-
152
-
153
-
154
-
155
-
156
-
157
-
158
-
159
-
160
-
161
-
162
-
163
-
164
-
165
-
166
-
167
-
168
-
169
-
170
-
171
-
172
-
173
-
174
-
175
-
176
-
177
-
178
-
179
-
180
-
181
-
182
-
183
-
184
-
185
-
186
-
187
-
188
-
189
-
190
-
191
-
192
-
193
-
194
-
195
-
196
-
197
-
198
-
199
-
200
-
201
-
202
-
203
-
204
-
205
-
206
-
207
-
208
-
209
-
210
-
211
-
212
-
213
-
214
-
215
-
216
-
217
-
218
-
219
-
220
-
221
-
222
-
223
-
224
-
225
-
226
-
227
-
228
-
229
-
230
-
231
-
232
-
233
-
234
-
235
-
236
-
237
-
238
-
239
-
240
-
241
-
242
-
243
-
244
-
245
-
246
-
247
-
248
-
249
-
250
-
251
-
252
-
253
-
254
-
255
-
256
-
257
-
258
-
259
-
260
-
261
-
262
-
263
-
264
-
265
-
266
-
267
-
268
-
269
-
270
-
271
-
272
-
273
-
274
-
275
-
276
-
277
-
278
-
279
-
280
-
281
-
282
-
283
-
284
-
285
-
286
-
287
-
288
-
289
-
290
-
291
-
292
-
293
-
294
-
295
-
296
-
297
-
298
-
299
-
300
-
301
-
302
-
303
-
304
-
305
-
306
-
307
-
308
-
309
-
310
-
311
-
312
-
313
-
314
-
315
-
316
-
317
-
318
-
319
-
320
-
321
-
322
-
323
-
324
-
325
-
326
-
327
-
328
-
329
-
330
-
331
-
332
-
333
-
334
-
335
-
336
-
337
-
338
-
339
-
340
-
341
-
342
-
343
-
344
-
345
-
346
-
347
-
348
-
349
-
350
-
351
-
352
-
353
-
354
-
355
-
356
-
357
-
358
-
359
-
360
-
361
-
362
-
363
-
364
-
365
-
366
-
367
-
368
-
369
-
370
-
371
-
372
-
373
-
374
-
375
-
376
-
377
-
378
-
379
-
380
-
381
-
382
-
383
-
384
-
385
-
386
-
387
-
388
-
389
-
390
-
391
-
392
-
393
-
394
-
395
-
396
-
397
-
398
-
399
-
400
-
401
-
402
-
403
-
404
-
405
-
406
-
407
-
408
-
409
-
410
-
411
-
412
-
413
-
414
-
415
-
416
-
417
-
418
-
419
-
420
-
421
-
422
-
423
-
424
-
425
-
426
-
427
-
428
-
429
-
430
-
431
-
432
-
433
-
434
-
435
-
436
-
437
-
438
-
439
-
440
-
441
-
442
-
443
-
444
-
445
-
446
-
447
-
448
-
449
-
450
-
451
-
452
-
453
-
454
-
455
-
456
-
457
-
458
-
459
-
460
-
461
-
462
-
463
-
464
-
465
-
466
-
467
-
468
-
469
-
470
-
471
-
472
 |
 |

77
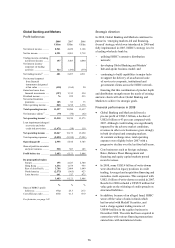
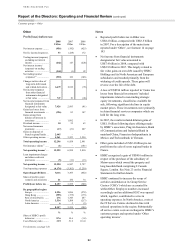
• In Global Asset Management, although
underlying management fees remained strong,
overall revenues fell, primarily due to the costs
associated with the provision of support to
certain money market funds. A fall in
performance fees reflected a 20 per cent
decrease in funds under management following
recent equity market declines. Nevertheless,
HSBC remained one of the leading emerging
markets asset managers.
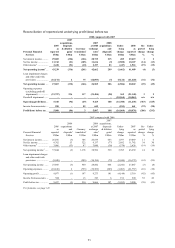
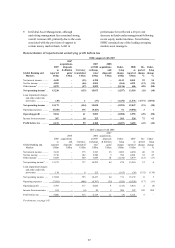
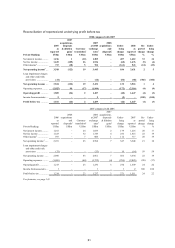
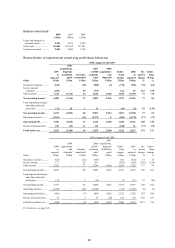
Reconciliation of reported and underlying profit before tax
2008 compared with 2007
Global Banking and
Markets
2007
as
reported
US$m
2007
acquisitions,
disposals
& dilution
gains1
US$m
Currency
translation2
US$m
2007
at 2008
exchange
rates3
US$m
2008
acquisitions
and
disposals1
US$m
Under-
lying
change
US$m
2008
as
reported
US$m
Re-
ported
change
%
Under-
lying
change
%
Net interest income .......... 4,430 – (32) 4,398 – 4,143 8,541 93 94
Net fee income ................. 4,901 – (46) 4,855 –
(564) 4,291 (12) (12)
Other income4 .................. 5,879 – (57) 5,822 – (5,136) 686 (88) (88)
Net operating income5 ... 15,210 – (135) 15,075 – (1,557) 13,518 (11) (10)
Loan impairment charges
and other credit risk
provisions .................... (38) – 1 (37) – (1,434) (1,471) (3,771) (3,876)
Net operating income .... 15,172 – (134) 15,038 – (2,991) 12,047 (21) (20)
Operating expenses .......... (9,358) – 175 (9,183) – 91 (9,092) 3 1
Operating profit ............. 5,814 – 41 5,855 – (2,900) 2,955 (49) (50)
Income from associates ... 307 – 18 325 – 203 528 72 62
Profit before tax ............. 6,121 – 59 6,180 – (2,697) 3,483 (43) (44)
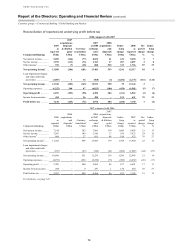
2007 compared with 2006
Global Banking and
Markets
2006
as
reported
US$m
2006
acquisitions
and
disposals1
US$m
Currency
translation2
US$m
2006
at 2007
exchange
rates6
US$m
2007
acquisitions,
disposals
& dilution
gains1
US$m
Under-
lying
change
US$m
2007
as
reported
US$m
Re-
ported
change
%
Under-
lying
change
%
Net interest income .......... 3,168 – 175 3,343 25 1,062 4,430 40 32
Net fee income ................. 3,718 – 182 3,900 9 992 4,901 32 25
Other income4 .................. 6,689 – 360 7,049 10 (1,180) 5,879 (12) (17)
Net operating income5 ..... 13,575 – 717 14,292 44 874 15,210 12 6
Loan impairment charges
and other credit risk
provisions .................... 119 – 6 125 – (163) (38) (132) (130)
Net operating income ...... 13,694 – 723 14,417 44 711 15,172 11 5
Operating expenses .......... (7,991) – (406) (8,397) (35) (926) (9,358) (17) (11)
Operating profit ............... 5,703 – 317 6,020 9 (215) 5,814 2 (4)
Income from associates ... 103 – (4) 99 2 206 307 198 208
Profit before tax ............... 5,806 – 313 6,119 11 (9) 6,121 5 –
For footnotes, see page 143.