HSBC 2008 Annual Report Download - page 118
Download and view the complete annual report
Please find page 118 of the 2008 HSBC annual report below. You can navigate through the pages in the report by either clicking on the pages listed below, or by using the keyword search tool below to find specific information within the annual report.-
 1
1 -
2
-
3
-
4
-
5
-
6
-
7
-
8
-
9
-
10
-
11
-
12
-
13
-
14
-
15
-
16
-
17
-
18
-
19
-
20
-
21
-
22
-
23
-
24
-
25
-
26
-
27
-
28
-
29
-
30
-
31
-
32
-
33
-
34
-
35
-
36
-
37
-
38
-
39
-
40
-
41
-
42
-
43
-
44
-
45
-
46
-
47
-
48
-
49
-
50
-
51
-
52
-
53
-
54
-
55
-
56
-
57
-
58
-
59
-
60
-
61
-
62
-
63
-
64
-
65
-
66
-
67
-
68
-
69
-
70
-
71
-
72
-
73
-
74
-
75
-
76
-
77
-
78
-
79
-
80
-
81
-
82
-
83
-
84
-
85
-
86
-
87
-
88
-
89
-
90
-
91
-
92
-
93
-
94
-
95
-
96
-
97
-
98
-
99
-
100
-
101
-
102
-
103
-
104
-
105
-
106
-
107
-
 108
108 -
 109
109 -
 110
110 -
 111
111 -
 112
112 -
 113
113 -
 114
114 -
 115
115 -
 116
116 -
 117
117 -
 118
118 -
 119
119 -
 120
120 -
 121
121 -
 122
122 -
 123
123 -
 124
124 -
 125
125 -
 126
126 -
 127
127 -
 128
128 -
129
-
130
-
131
-
132
-
133
-
134
-
135
-
136
-
137
-
138
-
139
-
140
-
141
-
142
-
143
-
144
-
145
-
146
-
147
-
148
-
149
-
150
-
151
-
152
-
153
-
154
-
155
-
156
-
157
-
158
-
159
-
160
-
161
-
162
-
163
-
164
-
165
-
166
-
167
-
168
-
169
-
170
-
171
-
172
-
173
-
174
-
175
-
176
-
177
-
178
-
179
-
180
-
181
-
182
-
183
-
184
-
185
-
186
-
187
-
188
-
189
-
190
-
191
-
192
-
193
-
194
-
195
-
196
-
197
-
198
-
199
-
200
-
201
-
202
-
203
-
204
-
205
-
206
-
207
-
208
-
209
-
210
-
211
-
212
-
213
-
214
-
215
-
216
-
217
-
218
-
219
-
220
-
221
-
222
-
223
-
224
-
225
-
226
-
227
-
228
-
229
-
230
-
231
-
232
-
233
-
234
-
235
-
236
-
237
-
238
-
239
-
240
-
241
-
242
-
243
-
244
-
245
-
246
-
247
-
248
-
249
-
250
-
251
-
252
-
253
-
254
-
255
-
256
-
257
-
258
-
259
-
260
-
261
-
262
-
263
-
264
-
265
-
266
-
267
-
268
-
269
-
270
-
271
-
272
-
273
-
274
-
275
-
276
-
277
-
278
-
279
-
280
-
281
-
282
-
283
-
284
-
285
-
286
-
287
-
288
-
289
-
290
-
291
-
292
-
293
-
294
-
295
-
296
-
297
-
298
-
299
-
300
-
301
-
302
-
303
-
304
-
305
-
306
-
307
-
308
-
309
-
310
-
311
-
312
-
313
-
314
-
315
-
316
-
317
-
318
-
319
-
320
-
321
-
322
-
323
-
324
-
325
-
326
-
327
-
328
-
329
-
330
-
331
-
332
-
333
-
334
-
335
-
336
-
337
-
338
-
339
-
340
-
341
-
342
-
343
-
344
-
345
-
346
-
347
-
348
-
349
-
350
-
351
-
352
-
353
-
354
-
355
-
356
-
357
-
358
-
359
-
360
-
361
-
362
-
363
-
364
-
365
-
366
-
367
-
368
-
369
-
370
-
371
-
372
-
373
-
374
-
375
-
376
-
377
-
378
-
379
-
380
-
381
-
382
-
383
-
384
-
385
-
386
-
387
-
388
-
389
-
390
-
391
-
392
-
393
-
394
-
395
-
396
-
397
-
398
-
399
-
400
-
401
-
402
-
403
-
404
-
405
-
406
-
407
-
408
-
409
-
410
-
411
-
412
-
413
-
414
-
415
-
416
-
417
-
418
-
419
-
420
-
421
-
422
-
423
-
424
-
425
-
426
-
427
-
428
-
429
-
430
-
431
-
432
-
433
-
434
-
435
-
436
-
437
-
438
-
439
-
440
-
441
-
442
-
443
-
444
-
445
-
446
-
447
-
448
-
449
-
450
-
451
-
452
-
453
-
454
-
455
-
456
-
457
-
458
-
459
-
460
-
461
-
462
-
463
-
464
-
465
-
466
-
467
-
468
-
469
-
470
-
471
-
472
 |
 |

HSBC HOLDINGS PLC
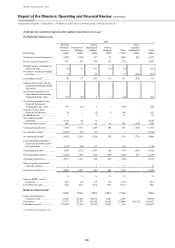
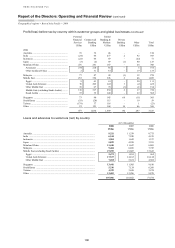
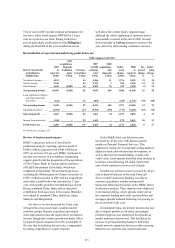
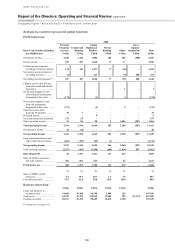
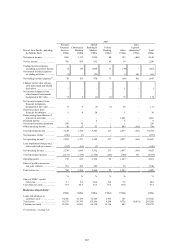
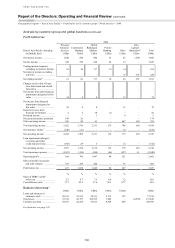
Report of the Directors: Operating and Financial Review (continued)
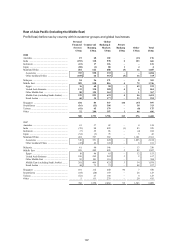
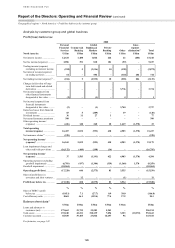
Geographical regions > Rest of Asia-Pacific > Profit before tax by customer group
116
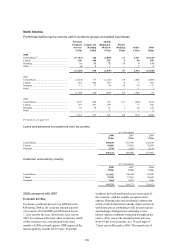
Analysis by customer group and global business
Profit before tax
2008
Rest of Asia-Pacific (including
the Middle East)
Personal
Financial
Services
US$m
Commercial
Banking
US$m
Global
Banking &
Markets
US$m
Private
Banking
US$m
Other
US$m
Inter-
segment
elimination21
US$m
Total
US$m
Net interest income ..................... 2,360 1,444 1,886 106 185 (488) 5,493
Net fee income ............................ 819 597 1,048 77 17 – 2,558
Trading income/(expense)
excluding net interest income 112 187 1,477 77 (30) – 1,823
Net interest income/(expense)
on trading activities ................ (5) – 143 – (5) 488 621
Net trading income/(expense)16 ... 107 187 1,620 77 (35) 488 2,444
Changes in fair value of long-
term debt issued and related
derivatives .............................. – – – – 1 – 1
Net income/(expense) from
other financial instruments
designated at fair value ........... (172) – (4) – 4 – (172)
Net income/(expense) from
financial instruments
designated at fair value ........... (172) – (4) – 5 – (171)
Gains less losses from
financial investments .............. 29 3 – – – – 32
Dividend income ......................... – – 4 – – – 4
Net earned insurance premiums . 172 25 – – – – 197
Other operating income ............... 79 84 90 2 1,096 (287) 1,064
Total operating income ............ 3,394 2,340 4,644 262 1,268 (287) 11,621
Net insurance claims17 ................ 42 (14) – – – – 28
Net operating income5 .............. 3,436 2,326 4,644 262 1,268 (287) 11,649
Loan impairment charges and
other credit risk provisions ..... (863) (182) (85) (1) – – (1,131)
Net operating income ............... 2,573 2,144 4,559 261 1,268 (287) 10,518
Total operating expenses ............ (2,527) (953) (1,298) (148) (1,024) 287 (5,663)
Operating profit ........................ 46 1,191 3,261 113 244 – 4,855
Share of profit in associates
and joint ventures ................... 454 602 525 – 32 – 1,613
Profit before tax ........................ 500 1,793 3,786 113 276 – 6,468
% % % % % %
Share of HSBC’s profit
before tax ................................ 5.4 19.3 40.7 1.2 2.9 69.5
Cost efficiency ratio ................... 73.5 41.0 28.0 56.5 80.8 48.6
Balance sheet data15
US$m US$m US$m US$m US$m US$m
Loans and advances to
customers (net) ....................... 34,860 35,188 34,590 2,989 329 107,956
Total assets ................................. 44,478 43,702 172,049 12,486 702 (11,112) 262,305
Customer accounts ...................... 56,531 36,350 50,605 14,475 1,398 159,359
For footnotes, see page 143.