HSBC 2008 Annual Report Download - page 133
Download and view the complete annual report
Please find page 133 of the 2008 HSBC annual report below. You can navigate through the pages in the report by either clicking on the pages listed below, or by using the keyword search tool below to find specific information within the annual report.-
 1
1 -
2
-
3
-
4
-
5
-
6
-
7
-
8
-
9
-
10
-
11
-
12
-
13
-
14
-
15
-
16
-
17
-
18
-
19
-
20
-
21
-
22
-
23
-
24
-
25
-
26
-
27
-
28
-
29
-
30
-
31
-
32
-
33
-
34
-
35
-
36
-
37
-
38
-
39
-
40
-
41
-
42
-
43
-
44
-
45
-
46
-
47
-
48
-
49
-
50
-
51
-
52
-
53
-
54
-
55
-
56
-
57
-
58
-
59
-
60
-
61
-
62
-
63
-
64
-
65
-
66
-
67
-
68
-
69
-
70
-
71
-
72
-
73
-
74
-
75
-
76
-
77
-
78
-
79
-
80
-
81
-
82
-
83
-
84
-
85
-
86
-
87
-
88
-
89
-
90
-
91
-
92
-
93
-
94
-
95
-
96
-
97
-
98
-
99
-
100
-
101
-
102
-
103
-
104
-
105
-
106
-
107
-
108
-
109
-
110
-
111
-
112
-
113
-
114
-
115
-
116
-
117
-
118
-
119
-
120
-
121
-
122
-
 123
123 -
 124
124 -
 125
125 -
 126
126 -
 127
127 -
 128
128 -
 129
129 -
 130
130 -
 131
131 -
 132
132 -
 133
133 -
 134
134 -
 135
135 -
 136
136 -
 137
137 -
 138
138 -
 139
139 -
 140
140 -
 141
141 -
 142
142 -
 143
143 -
144
-
145
-
146
-
147
-
148
-
149
-
150
-
151
-
152
-
153
-
154
-
155
-
156
-
157
-
158
-
159
-
160
-
161
-
162
-
163
-
164
-
165
-
166
-
167
-
168
-
169
-
170
-
171
-
172
-
173
-
174
-
175
-
176
-
177
-
178
-
179
-
180
-
181
-
182
-
183
-
184
-
185
-
186
-
187
-
188
-
189
-
190
-
191
-
192
-
193
-
194
-
195
-
196
-
197
-
198
-
199
-
200
-
201
-
202
-
203
-
204
-
205
-
206
-
207
-
208
-
209
-
210
-
211
-
212
-
213
-
214
-
215
-
216
-
217
-
218
-
219
-
220
-
221
-
222
-
223
-
224
-
225
-
226
-
227
-
228
-
229
-
230
-
231
-
232
-
233
-
234
-
235
-
236
-
237
-
238
-
239
-
240
-
241
-
242
-
243
-
244
-
245
-
246
-
247
-
248
-
249
-
250
-
251
-
252
-
253
-
254
-
255
-
256
-
257
-
258
-
259
-
260
-
261
-
262
-
263
-
264
-
265
-
266
-
267
-
268
-
269
-
270
-
271
-
272
-
273
-
274
-
275
-
276
-
277
-
278
-
279
-
280
-
281
-
282
-
283
-
284
-
285
-
286
-
287
-
288
-
289
-
290
-
291
-
292
-
293
-
294
-
295
-
296
-
297
-
298
-
299
-
300
-
301
-
302
-
303
-
304
-
305
-
306
-
307
-
308
-
309
-
310
-
311
-
312
-
313
-
314
-
315
-
316
-
317
-
318
-
319
-
320
-
321
-
322
-
323
-
324
-
325
-
326
-
327
-
328
-
329
-
330
-
331
-
332
-
333
-
334
-
335
-
336
-
337
-
338
-
339
-
340
-
341
-
342
-
343
-
344
-
345
-
346
-
347
-
348
-
349
-
350
-
351
-
352
-
353
-
354
-
355
-
356
-
357
-
358
-
359
-
360
-
361
-
362
-
363
-
364
-
365
-
366
-
367
-
368
-
369
-
370
-
371
-
372
-
373
-
374
-
375
-
376
-
377
-
378
-
379
-
380
-
381
-
382
-
383
-
384
-
385
-
386
-
387
-
388
-
389
-
390
-
391
-
392
-
393
-
394
-
395
-
396
-
397
-
398
-
399
-
400
-
401
-
402
-
403
-
404
-
405
-
406
-
407
-
408
-
409
-
410
-
411
-
412
-
413
-
414
-
415
-
416
-
417
-
418
-
419
-
420
-
421
-
422
-
423
-
424
-
425
-
426
-
427
-
428
-
429
-
430
-
431
-
432
-
433
-
434
-
435
-
436
-
437
-
438
-
439
-
440
-
441
-
442
-
443
-
444
-
445
-
446
-
447
-
448
-
449
-
450
-
451
-
452
-
453
-
454
-
455
-
456
-
457
-
458
-
459
-
460
-
461
-
462
-
463
-
464
-
465
-
466
-
467
-
468
-
469
-
470
-
471
-
472
 |
 |

131
unemployment well below levels observed a year
earlier. In line with many other economies within the
region, however, conditions weakened markedly
towards the end of 2008, with industrial production
falling by close to 20 per cent during the fourth
quarter.
In Argentina, economic activity held at a
reasonably robust level for much of the year,
although measures of industrial production growth
slowed noticeably during the final months of 2008.
Declines in commodity prices during the second half
of 2008 and the reduced value of exports raised
concerns over the level of capital outflow from the
country, while domestic currency interest rates
increased sharply. The official headline rate of
consumer price inflation rose during the first half of
2008, reaching 9.3 per cent in June 2008 before
slowing to 7.2 per cent in December, although
methodological changes make comparisons over
year difficult.
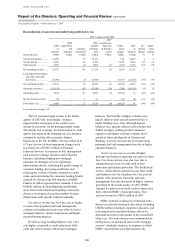
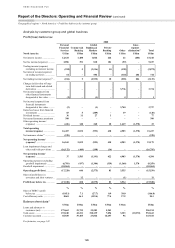
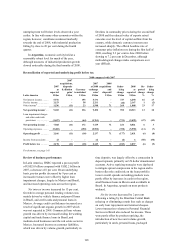
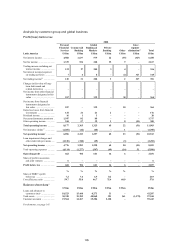
Reconciliation of reported and underlying profit before tax
2008 compared with 2007
Latin America
2007
as
reported
US$m
2007
acquisitions,
disposals
& dilution
gains1
US$m
Currency
translation2
US$m
2007
at 2008
exchange
rates3
US$m
2008
acquisitions
and
disposals1
US$m
Under-
lying
change
US$m
2008
as
reported
US$m
Re-
ported
change
%
Under-
lying
change
%
Net interest income .......... 5,576 – 155 5,731 – 727 6,458 16 13
Net fee income ................. 2,153 – 58 2,211 –
(44) 2,167 1 (2)
Other income4................... 1,536 (11) 23 1,548 71 269 1,888 23 17
Net operating income5.... 9,265 (11) 236 9,490 71 952 10,513 13 10
Loan impairment charges
and other credit risk
provisions .................... (1,697) – (64) (1,761) – (731) (2,492) (47) (42)
Net operating income .... 7,568 (11) 172 7,729 71 221 8,021 6 3
Operating expenses .......... (5,402) – (190) (5,592) – (398) (5,990) (11) (7)
Operating profit ............. 2,166 (11) (18) 2,137 71 (177) 2,031 (6) (8)
Income from associates ... 12 – – 12 – (6) 6 (50) (50)
Profit before tax ............. 2,178 (11) (18) 2,149 71 (183) 2,037 (6) (9)
For footnotes, see page 143.
Review of business performance
In Latin America, HSBC reported a pre-tax profit
of US$2.0 billion compared with US$2.2 billion in
2007, a decrease of 6 per cent. On an underlying
basis, pre-tax profits decreased by 9 per cent as
increased revenues were offset by higher loan
impairment charges, largely in Mexico and Brazil,
and increased operating costs across the region.
Net interest income increased by 13 per cent.
Growth in average personal lending volumes was
mainly driven by vehicle finance and payroll loans
in Brazil, and credit cards and personal loans in
Mexico. Average credit card balances increased as a
result of significant organic growth in 2007 which
was not repeated in 2008. Commercial loan volume
growth was driven by increased lending for working
capital and trade finance loans in Brazil, and
medium-sized businesses and the real estate sector in
Mexico. Increased income on customer liabilities,
which was driven by volume growth, particularly in
time deposits, was largely offset by a contraction in
deposit spreads, primarily on US dollar denominated
accounts. Active repricing strategies were deployed
to mitigate spread compression in the region and to
better reflect the credit risk on the loan portfolio.
Lower overall spreads on lending products were
partly offset by increases in cards in the region,
small business loans in Mexico and overdrafts in
Brazil. In Argentina, spreads on most products
widened.
Net fee income decreased by 2 per cent
following a ruling by the Brazilian Central Bank
reducing or eliminating certain fees such as charges
on early loan repayments and returned cheques.
Lower transaction volumes in Personal Financial
Services in Brazil also reduced fee income. These
were partly offset by product repricing, the
introduction of new fees and volume growth,
particularly in cards, personal loans, packaged