HSBC 2008 Annual Report Download - page 160
Download and view the complete annual report
Please find page 160 of the 2008 HSBC annual report below. You can navigate through the pages in the report by either clicking on the pages listed below, or by using the keyword search tool below to find specific information within the annual report.-
 1
1 -
2
-
3
-
4
-
5
-
6
-
7
-
8
-
9
-
10
-
11
-
12
-
13
-
14
-
15
-
16
-
17
-
18
-
19
-
20
-
21
-
22
-
23
-
24
-
25
-
26
-
27
-
28
-
29
-
30
-
31
-
32
-
33
-
34
-
35
-
36
-
37
-
38
-
39
-
40
-
41
-
42
-
43
-
44
-
45
-
46
-
47
-
48
-
49
-
50
-
51
-
52
-
53
-
54
-
55
-
56
-
57
-
58
-
59
-
60
-
61
-
62
-
63
-
64
-
65
-
66
-
67
-
68
-
69
-
70
-
71
-
72
-
73
-
74
-
75
-
76
-
77
-
78
-
79
-
80
-
81
-
82
-
83
-
84
-
85
-
86
-
87
-
88
-
89
-
90
-
91
-
92
-
93
-
94
-
95
-
96
-
97
-
98
-
99
-
100
-
101
-
102
-
103
-
104
-
105
-
106
-
107
-
108
-
109
-
110
-
111
-
112
-
113
-
114
-
115
-
116
-
117
-
118
-
119
-
120
-
121
-
122
-
123
-
124
-
125
-
126
-
127
-
128
-
129
-
130
-
131
-
132
-
133
-
134
-
135
-
136
-
137
-
138
-
139
-
140
-
141
-
142
-
143
-
144
-
145
-
146
-
147
-
148
-
149
-
 150
150 -
 151
151 -
 152
152 -
 153
153 -
 154
154 -
 155
155 -
 156
156 -
 157
157 -
 158
158 -
 159
159 -
 160
160 -
 161
161 -
 162
162 -
 163
163 -
 164
164 -
 165
165 -
 166
166 -
 167
167 -
 168
168 -
 169
169 -
 170
170 -
171
-
172
-
173
-
174
-
175
-
176
-
177
-
178
-
179
-
180
-
181
-
182
-
183
-
184
-
185
-
186
-
187
-
188
-
189
-
190
-
191
-
192
-
193
-
194
-
195
-
196
-
197
-
198
-
199
-
200
-
201
-
202
-
203
-
204
-
205
-
206
-
207
-
208
-
209
-
210
-
211
-
212
-
213
-
214
-
215
-
216
-
217
-
218
-
219
-
220
-
221
-
222
-
223
-
224
-
225
-
226
-
227
-
228
-
229
-
230
-
231
-
232
-
233
-
234
-
235
-
236
-
237
-
238
-
239
-
240
-
241
-
242
-
243
-
244
-
245
-
246
-
247
-
248
-
249
-
250
-
251
-
252
-
253
-
254
-
255
-
256
-
257
-
258
-
259
-
260
-
261
-
262
-
263
-
264
-
265
-
266
-
267
-
268
-
269
-
270
-
271
-
272
-
273
-
274
-
275
-
276
-
277
-
278
-
279
-
280
-
281
-
282
-
283
-
284
-
285
-
286
-
287
-
288
-
289
-
290
-
291
-
292
-
293
-
294
-
295
-
296
-
297
-
298
-
299
-
300
-
301
-
302
-
303
-
304
-
305
-
306
-
307
-
308
-
309
-
310
-
311
-
312
-
313
-
314
-
315
-
316
-
317
-
318
-
319
-
320
-
321
-
322
-
323
-
324
-
325
-
326
-
327
-
328
-
329
-
330
-
331
-
332
-
333
-
334
-
335
-
336
-
337
-
338
-
339
-
340
-
341
-
342
-
343
-
344
-
345
-
346
-
347
-
348
-
349
-
350
-
351
-
352
-
353
-
354
-
355
-
356
-
357
-
358
-
359
-
360
-
361
-
362
-
363
-
364
-
365
-
366
-
367
-
368
-
369
-
370
-
371
-
372
-
373
-
374
-
375
-
376
-
377
-
378
-
379
-
380
-
381
-
382
-
383
-
384
-
385
-
386
-
387
-
388
-
389
-
390
-
391
-
392
-
393
-
394
-
395
-
396
-
397
-
398
-
399
-
400
-
401
-
402
-
403
-
404
-
405
-
406
-
407
-
408
-
409
-
410
-
411
-
412
-
413
-
414
-
415
-
416
-
417
-
418
-
419
-
420
-
421
-
422
-
423
-
424
-
425
-
426
-
427
-
428
-
429
-
430
-
431
-
432
-
433
-
434
-
435
-
436
-
437
-
438
-
439
-
440
-
441
-
442
-
443
-
444
-
445
-
446
-
447
-
448
-
449
-
450
-
451
-
452
-
453
-
454
-
455
-
456
-
457
-
458
-
459
-
460
-
461
-
462
-
463
-
464
-
465
-
466
-
467
-
468
-
469
-
470
-
471
-
472
 |
 |

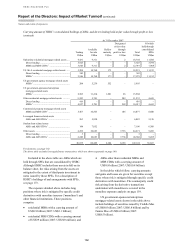
HSBC HOLDINGS PLC
Report of the Directors: Impact of Market Turmoil (continued)
Nature and extent of exposures > Monolines
158
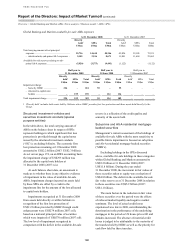
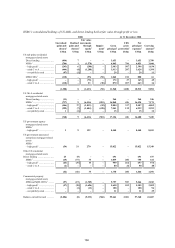
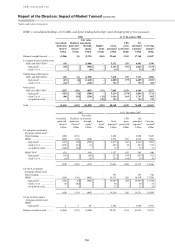
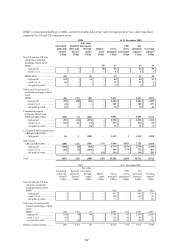
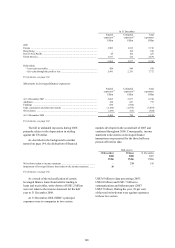
HSBC’s consolidated holdings of ABSs, and direct lending held at fair value through profit or loss, other than those
supported by US and UK-originated assets (continued)
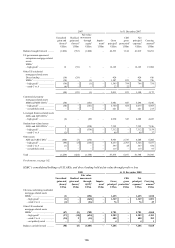
2007 At 31 December 2007
Unrealised
gains and
(losses)3
Realised
gains and
(losses)4
Fair value
movements
through
equity5
Impair-
ment6
Gross
principal7
CDS
gross
protection8
Net
principal
exposure9
Carrying
amount10
US$m US$m US$m US$m US$m US$m US$m US$m
Balance brought forward ........... (20) (10) (6) – 4,625 814 3,811 3,440
Commercial property
mortgage-related assets
MBS and MBS CDOs1 .......... (9) – (20) – 3,576 238 3,338 3,051
– high grade2 .......................... (6) – (20) – 3,212 102 3,110 2,827
– rated C to A ........................ (3) – – – 185 136 49 49
– not publicly rated ................ – – – – 179 – 179 175
Leveraged finance-related assets
ABSs and ABS CDOs1 .......... (3) – (20) – 1,356 3 1,353 1,315
– high grade2 .......................... (3) – (20) – 1,281 2 1,279 1,244
– not publicly rated ................ – – – – 75 1 74 71
Other assets
Direct lending ........................ – – – – 3 – 3 3
ABS and ABS CDOs1 ........... (2) 6 (18) (36) 7,929 1,702 6,227 6,113
– high grade2 .......................... (5) (2) (18) (36) 7,310 1,443 5,867 5,550
– rated C to A ........................ – 5 – – 547 259 288 522
– not publicly rated ................ 3 3 – – 72 – 72 41
(2) 6 (18) (36) 7,932 1,702 6,230 6,116
Total ........................................... (34) (4) (64) (36) 17,489 2,757 14,732 13,922
For footnotes, see page 162.
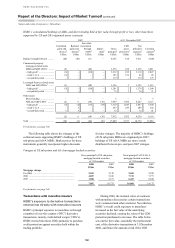
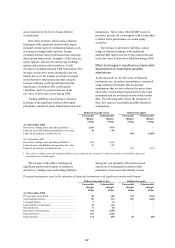
The following table shows the vintages of the
collateral assets supporting HSBC’s holdings of US
sub-prime and Alt-A MBSs. Market prices for these
instruments generally incorporate higher discounts
for later vintages. The majority of HSBC’s holdings
of US sub-prime MBSs are originated pre-2007;
holdings of US Alt-A MBSs are more evenly
distributed between pre- and post-2007 vintages.
Vintages of US sub-prime and Alt-A mortgage-backed securities
Gross principal7 of US sub-prime
mortgage-backed securities
at 31 December
Gross principal7 of US Alt-A
mortgage-backed securities
at 31 December
2008 2007 2008 2007
US$m US$m US$m US$m
Mortgage vintage
Pre-2006 ........................................................................ 2,012 3,170 2,695 2,870
2006 .............................................................................. 4,287 5,186 7,712 7,777
2007 .............................................................................. 1,588 2,377 6,453 8,528
7,887 10,733 16,860 19,175
For footnotes, see page 162.
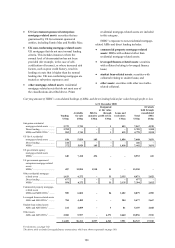
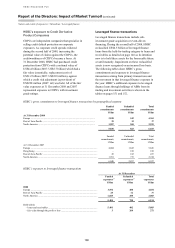
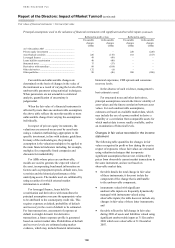
Transactions with monoline insurers
HSBC’s exposure to derivative transactions
entered into directly with monoline insurers
HSBC’s principal exposure to monolines is through
a number of over-the-counter (‘OTC’) derivative
transactions, mainly credit default swaps (‘CDS’s).
HSBC entered into these CDSs primarily to purchase
credit protection against securities held within the
trading portfolio.
During 2008, the notional value of contracts
with monolines decreased as certain transactions
were commuted and others matured. Nevertheless,
HSBC’s overall credit exposure to monolines
increased as the fair value of the underlying
securities declined, causing the value of the CDS
protection purchased to increase. The table below
sets out the fair value, essentially the replacement
cost, of the derivative transactions at 31 December
2008, and hence the amount at risk if the CDS