HSBC 2008 Annual Report Download - page 281
Download and view the complete annual report
Please find page 281 of the 2008 HSBC annual report below. You can navigate through the pages in the report by either clicking on the pages listed below, or by using the keyword search tool below to find specific information within the annual report.-
 1
1 -
2
-
3
-
4
-
5
-
6
-
7
-
8
-
9
-
10
-
11
-
12
-
13
-
14
-
15
-
16
-
17
-
18
-
19
-
20
-
21
-
22
-
23
-
24
-
25
-
26
-
27
-
28
-
29
-
30
-
31
-
32
-
33
-
34
-
35
-
36
-
37
-
38
-
39
-
40
-
41
-
42
-
43
-
44
-
45
-
46
-
47
-
48
-
49
-
50
-
51
-
52
-
53
-
54
-
55
-
56
-
57
-
58
-
59
-
60
-
61
-
62
-
63
-
64
-
65
-
66
-
67
-
68
-
69
-
70
-
71
-
72
-
73
-
74
-
75
-
76
-
77
-
78
-
79
-
80
-
81
-
82
-
83
-
84
-
85
-
86
-
87
-
88
-
89
-
90
-
91
-
92
-
93
-
94
-
95
-
96
-
97
-
98
-
99
-
100
-
101
-
102
-
103
-
104
-
105
-
106
-
107
-
108
-
109
-
110
-
111
-
112
-
113
-
114
-
115
-
116
-
117
-
118
-
119
-
120
-
121
-
122
-
123
-
124
-
125
-
126
-
127
-
128
-
129
-
130
-
131
-
132
-
133
-
134
-
135
-
136
-
137
-
138
-
139
-
140
-
141
-
142
-
143
-
144
-
145
-
146
-
147
-
148
-
149
-
150
-
151
-
152
-
153
-
154
-
155
-
156
-
157
-
158
-
159
-
160
-
161
-
162
-
163
-
164
-
165
-
166
-
167
-
168
-
169
-
170
-
171
-
172
-
173
-
174
-
175
-
176
-
177
-
178
-
179
-
180
-
181
-
182
-
183
-
184
-
185
-
186
-
187
-
188
-
189
-
190
-
191
-
192
-
193
-
194
-
195
-
196
-
197
-
198
-
199
-
200
-
201
-
202
-
203
-
204
-
205
-
206
-
207
-
208
-
209
-
210
-
211
-
212
-
213
-
214
-
215
-
216
-
217
-
218
-
219
-
220
-
221
-
222
-
223
-
224
-
225
-
226
-
227
-
228
-
229
-
230
-
231
-
232
-
233
-
234
-
235
-
236
-
237
-
238
-
239
-
240
-
241
-
242
-
243
-
244
-
245
-
246
-
247
-
248
-
249
-
250
-
251
-
252
-
253
-
254
-
255
-
256
-
257
-
258
-
259
-
260
-
261
-
262
-
263
-
264
-
265
-
266
-
267
-
268
-
269
-
270
-
 271
271 -
 272
272 -
 273
273 -
 274
274 -
 275
275 -
 276
276 -
 277
277 -
 278
278 -
 279
279 -
 280
280 -
 281
281 -
 282
282 -
 283
283 -
 284
284 -
 285
285 -
 286
286 -
 287
287 -
 288
288 -
 289
289 -
 290
290 -
 291
291 -
292
-
293
-
294
-
295
-
296
-
297
-
298
-
299
-
300
-
301
-
302
-
303
-
304
-
305
-
306
-
307
-
308
-
309
-
310
-
311
-
312
-
313
-
314
-
315
-
316
-
317
-
318
-
319
-
320
-
321
-
322
-
323
-
324
-
325
-
326
-
327
-
328
-
329
-
330
-
331
-
332
-
333
-
334
-
335
-
336
-
337
-
338
-
339
-
340
-
341
-
342
-
343
-
344
-
345
-
346
-
347
-
348
-
349
-
350
-
351
-
352
-
353
-
354
-
355
-
356
-
357
-
358
-
359
-
360
-
361
-
362
-
363
-
364
-
365
-
366
-
367
-
368
-
369
-
370
-
371
-
372
-
373
-
374
-
375
-
376
-
377
-
378
-
379
-
380
-
381
-
382
-
383
-
384
-
385
-
386
-
387
-
388
-
389
-
390
-
391
-
392
-
393
-
394
-
395
-
396
-
397
-
398
-
399
-
400
-
401
-
402
-
403
-
404
-
405
-
406
-
407
-
408
-
409
-
410
-
411
-
412
-
413
-
414
-
415
-
416
-
417
-
418
-
419
-
420
-
421
-
422
-
423
-
424
-
425
-
426
-
427
-
428
-
429
-
430
-
431
-
432
-
433
-
434
-
435
-
436
-
437
-
438
-
439
-
440
-
441
-
442
-
443
-
444
-
445
-
446
-
447
-
448
-
449
-
450
-
451
-
452
-
453
-
454
-
455
-
456
-
457
-
458
-
459
-
460
-
461
-
462
-
463
-
464
-
465
-
466
-
467
-
468
-
469
-
470
-
471
-
472
 |
 |

279
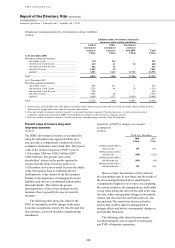
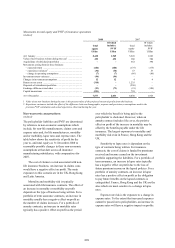
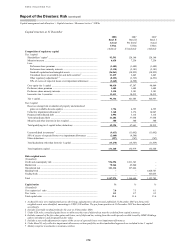
Source and application of tier 1 capital
(Audited)
2008
Basel II
US$m
2007
Basel I
US$m
Movement in tier 1 capital
(Audited)
At 1 January ......................................................................................................................................... 104,967 87,842
Changes to tier 1 capital arising from transition to pro forma Basel II basis2 .................................... (3,282)
Opening pro-forma tier 1 capital under Basel II rules2 ....................................................................... 101,685
Consolidated profits attributable to shareholders of the parent company .......................................... 5,728 19,133
Dividends to shareholders ................................................................................................................... (11,301) (10,241)
Add back: shares issued in lieu of dividends .................................................................................. 3,593 4,351
Decrease/(increase) in goodwill and intangible assets deducted ........................................................ 11,994 (2,366)
Removal of own credit spread.............................................................................................................. (4,610) (2,205)
Ordinary shares issued ......................................................................................................................... 470 477
Innovative tier 1 securities issued ....................................................................................................... 2,133 –
Other (including exchange differences)2 ............................................................................................. (14,356) 7,976
At 31 December ................................................................................................................................... 95,336 104,967
Movement in risk-weighted assets
(Unaudited)
At 1 January ......................................................................................................................................... 1,123,782 938,678
Changes arising to risk-weighted assets from transition to pro forma Basel II basis1 ........................ 40,867
Opening Basel II pro forma risk-weighted assets ............................................................................... 1,164,649
Movements .......................................................................................................................................... (16,675) 185,104
At 31 December ................................................................................................................................... 1,147,974 1,123,782
1 As Basel II rules were implemented across the Group, adjustments to the previously published 31 December 2007 pro forma risk-
weighted assets were identified, amounting to US$35,198 million. The pro forma position at 31 December 2007 has been adjusted
accordingly.
2 Pro forma capital items as at 1 January 2008 are unaudited.
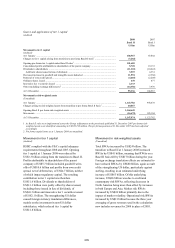
Movement in tier 1 capital
(Audited)
HSBC complied with the FSA’s capital adequacy
requirements throughout 2008 and 2007. Opening
tier 1 capital at 1 January 2008 was reduced by
US$3.3 billion arising from the transition to Basel II.
Profits attributable to shareholders of the parent
company of US$5.7 billion included goodwill write-
offs of US$10.6 billion and profits from own credit
spread, net of deferred tax, of US$4.7 billion, neither
of which impact regulatory capital. The resulting
contribution to tier 1 capital was therefore
US$11.6 billion. Dividends to shareholders of
US$11.3 billion were partly offset by shares issued,
including those issued in lieu of dividends, of
US$4.1 billion and innovative tier 1 securities issued
of US$2.1 billion. The strengthening US dollar
caused foreign currency translation differences,
mainly on the investment in non-US dollar
subsidiaries, which reduced tier 1 capital by
US$11.8 billion.
Movement in risk-weighted assets
(Unaudited)
Total RWAs increased by US$24 billion. The
transition to Basel II at 1 January 2008 increased
RWAs by US$41 billion, meaning that RWAs on a
Basel II basis fell by US$17 billion during the year.
Foreign exchange translation effects are estimated to
have reduced RWAs by US$80 billion, again a result
of the strengthening US dollar, particularly against
sterling, resulting in an estimated underlying
increase of US$63 billion. Of this underlying
increase, US$26 billion was due to credit and
counterparty risk RWAs, reflecting decreases in
North America being more than offset by increases
in both Europe and Asia. Market risk RWAs
increased by US$24 billion primarily due to the
impact of market volatility. Operational risk RWAs
increased by US$13 billion because the three year
averaging of gross revenues used in the calculation
now includes revenues for 2008 in place of 2005.