HSBC 2008 Annual Report Download - page 154
Download and view the complete annual report
Please find page 154 of the 2008 HSBC annual report below. You can navigate through the pages in the report by either clicking on the pages listed below, or by using the keyword search tool below to find specific information within the annual report.-
 1
1 -
2
-
3
-
4
-
5
-
6
-
7
-
8
-
9
-
10
-
11
-
12
-
13
-
14
-
15
-
16
-
17
-
18
-
19
-
20
-
21
-
22
-
23
-
24
-
25
-
26
-
27
-
28
-
29
-
30
-
31
-
32
-
33
-
34
-
35
-
36
-
37
-
38
-
39
-
40
-
41
-
42
-
43
-
44
-
45
-
46
-
47
-
48
-
49
-
50
-
51
-
52
-
53
-
54
-
55
-
56
-
57
-
58
-
59
-
60
-
61
-
62
-
63
-
64
-
65
-
66
-
67
-
68
-
69
-
70
-
71
-
72
-
73
-
74
-
75
-
76
-
77
-
78
-
79
-
80
-
81
-
82
-
83
-
84
-
85
-
86
-
87
-
88
-
89
-
90
-
91
-
92
-
93
-
94
-
95
-
96
-
97
-
98
-
99
-
100
-
101
-
102
-
103
-
104
-
105
-
106
-
107
-
108
-
109
-
110
-
111
-
112
-
113
-
114
-
115
-
116
-
117
-
118
-
119
-
120
-
121
-
122
-
123
-
124
-
125
-
126
-
127
-
128
-
129
-
130
-
131
-
132
-
133
-
134
-
135
-
136
-
137
-
138
-
139
-
140
-
141
-
142
-
143
-
 144
144 -
 145
145 -
 146
146 -
 147
147 -
 148
148 -
 149
149 -
 150
150 -
 151
151 -
 152
152 -
 153
153 -
 154
154 -
 155
155 -
 156
156 -
 157
157 -
 158
158 -
 159
159 -
 160
160 -
 161
161 -
 162
162 -
 163
163 -
 164
164 -
165
-
166
-
167
-
168
-
169
-
170
-
171
-
172
-
173
-
174
-
175
-
176
-
177
-
178
-
179
-
180
-
181
-
182
-
183
-
184
-
185
-
186
-
187
-
188
-
189
-
190
-
191
-
192
-
193
-
194
-
195
-
196
-
197
-
198
-
199
-
200
-
201
-
202
-
203
-
204
-
205
-
206
-
207
-
208
-
209
-
210
-
211
-
212
-
213
-
214
-
215
-
216
-
217
-
218
-
219
-
220
-
221
-
222
-
223
-
224
-
225
-
226
-
227
-
228
-
229
-
230
-
231
-
232
-
233
-
234
-
235
-
236
-
237
-
238
-
239
-
240
-
241
-
242
-
243
-
244
-
245
-
246
-
247
-
248
-
249
-
250
-
251
-
252
-
253
-
254
-
255
-
256
-
257
-
258
-
259
-
260
-
261
-
262
-
263
-
264
-
265
-
266
-
267
-
268
-
269
-
270
-
271
-
272
-
273
-
274
-
275
-
276
-
277
-
278
-
279
-
280
-
281
-
282
-
283
-
284
-
285
-
286
-
287
-
288
-
289
-
290
-
291
-
292
-
293
-
294
-
295
-
296
-
297
-
298
-
299
-
300
-
301
-
302
-
303
-
304
-
305
-
306
-
307
-
308
-
309
-
310
-
311
-
312
-
313
-
314
-
315
-
316
-
317
-
318
-
319
-
320
-
321
-
322
-
323
-
324
-
325
-
326
-
327
-
328
-
329
-
330
-
331
-
332
-
333
-
334
-
335
-
336
-
337
-
338
-
339
-
340
-
341
-
342
-
343
-
344
-
345
-
346
-
347
-
348
-
349
-
350
-
351
-
352
-
353
-
354
-
355
-
356
-
357
-
358
-
359
-
360
-
361
-
362
-
363
-
364
-
365
-
366
-
367
-
368
-
369
-
370
-
371
-
372
-
373
-
374
-
375
-
376
-
377
-
378
-
379
-
380
-
381
-
382
-
383
-
384
-
385
-
386
-
387
-
388
-
389
-
390
-
391
-
392
-
393
-
394
-
395
-
396
-
397
-
398
-
399
-
400
-
401
-
402
-
403
-
404
-
405
-
406
-
407
-
408
-
409
-
410
-
411
-
412
-
413
-
414
-
415
-
416
-
417
-
418
-
419
-
420
-
421
-
422
-
423
-
424
-
425
-
426
-
427
-
428
-
429
-
430
-
431
-
432
-
433
-
434
-
435
-
436
-
437
-
438
-
439
-
440
-
441
-
442
-
443
-
444
-
445
-
446
-
447
-
448
-
449
-
450
-
451
-
452
-
453
-
454
-
455
-
456
-
457
-
458
-
459
-
460
-
461
-
462
-
463
-
464
-
465
-
466
-
467
-
468
-
469
-
470
-
471
-
472
 |
 |
HSBC HOLDINGS PLC
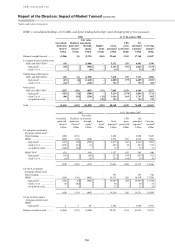
Report of the Directors: Impact of Market Turmoil (continued)
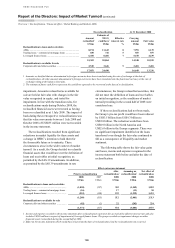
Nature and extent of exposures
152
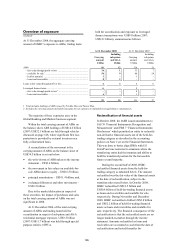
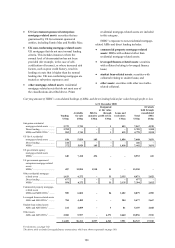
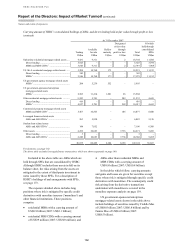
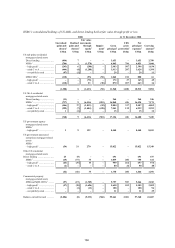
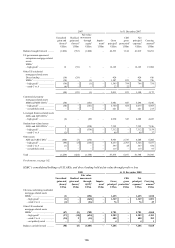
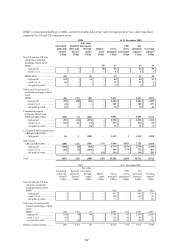
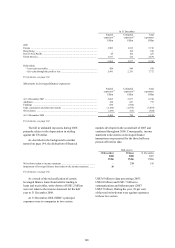
Carrying amount of HSBC’s consolidated holdings of ABSs, and direct lending held at fair value through profit or loss
(continued)
At 31 December 2007
Trading
Available
for sale
Held to
maturity
Designated
at fair value
through
profit or loss Total
Of which
held through
consolidated
SPEs
US$m US$m US$m US$m US$m US$m
Sub-prime residential mortgage-related assets ..... 9,431 9,311 – 2 18,744 11,504
Direct lending ................................................... 5,825 – – – 5,825 3,596
MBSs and MBS CDOs1 ................................... 3,606 9,311 – 2 12,919 7,908
US Alt-A residential mortgage-related assets ...... 3,288 14,760 173 – 18,221 11,193
Direct lending ................................................... 342 – – – 342 –
MBSs1 ............................................................... 2,946 14,760 173 – 17,879 11,193
US government agency mortgage-related assets
MBSs1 ............................................................... 204 5,239 552 – 5,995 –
US government-sponsored enterprises
mortgage-related assets
MBSs1 ............................................................... 2,583 11,414 1,881 26 15,904 –
Other residential mortgage-related assets ............ 5,243 5,701 – 289 11,233 4,441
Direct lending ................................................... 416 – – – 416 –
MBSs1 ............................................................... 4,827 5,701 – 289 10,817 4,441
Commercial property mortgage-related assets
MBSs and MBS CDO1 ..................................... 3,467 10,505 – 105 14,077 8,600
Leveraged finance-related assets
ABSs and ABS CDOs1 ..................................... 263 5,820 – – 6,083 5,126
Student loan-related assets
ABSs and ABS CDOs1 ..................................... 144 7,052 – – 7,196 6,308
Other assets ........................................................... 6,252 10,683 – 7,736 24,671 9,495
Direct lending ................................................... 3 – – – 3 –
ABSs and ABS CDOs1 ..................................... 6,249 10,683 – 7,736 24,668 9,495
30,875 80,485 2,606 8,158 122,124 56,667
For footnotes, see page 162.
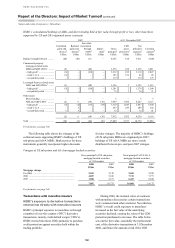
The above table excludes leveraged finance transactions, which are shown separately on page 160.
Included in the above table are ABSs which are
held through SPEs that are consolidated by HSBC.
Although HSBC includes these assets in full on its
balance sheet, the risks arising from the assets are
mitigated to the extent of third-party investment in
notes issued by those SPEs. For a description of
HSBC’s holdings of and arrangements with SPEs,
see page 173.
The exposure detailed above includes long
positions where risk is mitigated by specific credit
derivatives with monoline insurers (‘monolines’) and
other financial institutions. These positions
comprise:
• residential MBSs with a carrying amount of
US$0.9 billion (2007: US$2.1 billion);
• residential MBS CDOs with a carrying amount
of US$39 million (2007: US$349 million); and
• ABSs other than residential MBSs and
MBS CDOs with a carrying amount of
US$9.8 billion (2007: US$10.8 billion).
In the tables which follow, carrying amounts
and gains and losses are given for securities except
those where risk is mitigated through specific credit
derivatives with monolines. The counterparty credit
risk arising from the derivative transactions
undertaken with monolines is covered in the
monoline exposure analysis on page 159.
US government-sponsored enterprises
mortgage-related assets shown in the table above
include holdings of securities issued by Freddie Mac
of US$8.0 billion (2007: US$6.8 billion) and by
Fannie Mae of US$6.6 billion (2007:
US$8.5 billion).