HSBC 2008 Annual Report Download - page 414
Download and view the complete annual report
Please find page 414 of the 2008 HSBC annual report below. You can navigate through the pages in the report by either clicking on the pages listed below, or by using the keyword search tool below to find specific information within the annual report.-
 1
1 -
2
-
3
-
4
-
5
-
6
-
7
-
8
-
9
-
10
-
11
-
12
-
13
-
14
-
15
-
16
-
17
-
18
-
19
-
20
-
21
-
22
-
23
-
24
-
25
-
26
-
27
-
28
-
29
-
30
-
31
-
32
-
33
-
34
-
35
-
36
-
37
-
38
-
39
-
40
-
41
-
42
-
43
-
44
-
45
-
46
-
47
-
48
-
49
-
50
-
51
-
52
-
53
-
54
-
55
-
56
-
57
-
58
-
59
-
60
-
61
-
62
-
63
-
64
-
65
-
66
-
67
-
68
-
69
-
70
-
71
-
72
-
73
-
74
-
75
-
76
-
77
-
78
-
79
-
80
-
81
-
82
-
83
-
84
-
85
-
86
-
87
-
88
-
89
-
90
-
91
-
92
-
93
-
94
-
95
-
96
-
97
-
98
-
99
-
100
-
101
-
102
-
103
-
104
-
105
-
106
-
107
-
108
-
109
-
110
-
111
-
112
-
113
-
114
-
115
-
116
-
117
-
118
-
119
-
120
-
121
-
122
-
123
-
124
-
125
-
126
-
127
-
128
-
129
-
130
-
131
-
132
-
133
-
134
-
135
-
136
-
137
-
138
-
139
-
140
-
141
-
142
-
143
-
144
-
145
-
146
-
147
-
148
-
149
-
150
-
151
-
152
-
153
-
154
-
155
-
156
-
157
-
158
-
159
-
160
-
161
-
162
-
163
-
164
-
165
-
166
-
167
-
168
-
169
-
170
-
171
-
172
-
173
-
174
-
175
-
176
-
177
-
178
-
179
-
180
-
181
-
182
-
183
-
184
-
185
-
186
-
187
-
188
-
189
-
190
-
191
-
192
-
193
-
194
-
195
-
196
-
197
-
198
-
199
-
200
-
201
-
202
-
203
-
204
-
205
-
206
-
207
-
208
-
209
-
210
-
211
-
212
-
213
-
214
-
215
-
216
-
217
-
218
-
219
-
220
-
221
-
222
-
223
-
224
-
225
-
226
-
227
-
228
-
229
-
230
-
231
-
232
-
233
-
234
-
235
-
236
-
237
-
238
-
239
-
240
-
241
-
242
-
243
-
244
-
245
-
246
-
247
-
248
-
249
-
250
-
251
-
252
-
253
-
254
-
255
-
256
-
257
-
258
-
259
-
260
-
261
-
262
-
263
-
264
-
265
-
266
-
267
-
268
-
269
-
270
-
271
-
272
-
273
-
274
-
275
-
276
-
277
-
278
-
279
-
280
-
281
-
282
-
283
-
284
-
285
-
286
-
287
-
288
-
289
-
290
-
291
-
292
-
293
-
294
-
295
-
296
-
297
-
298
-
299
-
300
-
301
-
302
-
303
-
304
-
305
-
306
-
307
-
308
-
309
-
310
-
311
-
312
-
313
-
314
-
315
-
316
-
317
-
318
-
319
-
320
-
321
-
322
-
323
-
324
-
325
-
326
-
327
-
328
-
329
-
330
-
331
-
332
-
333
-
334
-
335
-
336
-
337
-
338
-
339
-
340
-
341
-
342
-
343
-
344
-
345
-
346
-
347
-
348
-
349
-
350
-
351
-
352
-
353
-
354
-
355
-
356
-
357
-
358
-
359
-
360
-
361
-
362
-
363
-
364
-
365
-
366
-
367
-
368
-
369
-
370
-
371
-
372
-
373
-
374
-
375
-
376
-
377
-
378
-
379
-
380
-
381
-
382
-
383
-
384
-
385
-
386
-
387
-
388
-
389
-
390
-
391
-
392
-
393
-
394
-
395
-
396
-
397
-
398
-
399
-
400
-
401
-
402
-
403
-
 404
404 -
 405
405 -
 406
406 -
 407
407 -
 408
408 -
 409
409 -
 410
410 -
 411
411 -
 412
412 -
 413
413 -
 414
414 -
 415
415 -
 416
416 -
 417
417 -
 418
418 -
 419
419 -
 420
420 -
 421
421 -
 422
422 -
 423
423 -
 424
424 -
425
-
426
-
427
-
428
-
429
-
430
-
431
-
432
-
433
-
434
-
435
-
436
-
437
-
438
-
439
-
440
-
441
-
442
-
443
-
444
-
445
-
446
-
447
-
448
-
449
-
450
-
451
-
452
-
453
-
454
-
455
-
456
-
457
-
458
-
459
-
460
-
461
-
462
-
463
-
464
-
465
-
466
-
467
-
468
-
469
-
470
-
471
-
472
 |
 |

HSBC HOLDINGS PLC
Notes on the Financial Statements (continued)
Notes 22 and 23
412
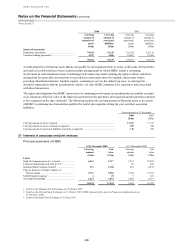
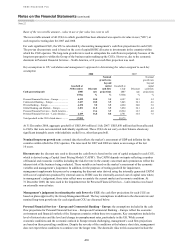
cash flows, a variety of assumptions regarding future experience is made by each insurance operation which reflects
local market conditions and management’s judgement of local future trends. Some of the Group’s insurance
operations incorporate risk margins separately into the projection assumptions for each product, while others
incorporate risk margins into the overall discount rate. This is reflected in the wide range of risk discount rates
applied.
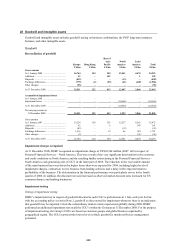
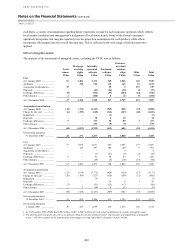
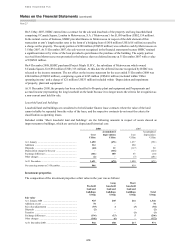
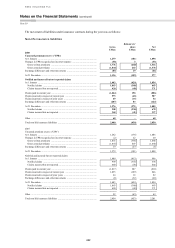
Other intangible assets
The analysis of the movement of intangible assets, excluding the PVIF, was as follows:
Trade
names
Mortgage
servicing
rights
Internally
generated
software
Purchased
software
Customer/
merchant
relation-
ships Other Total
US$m US$m US$m US$m US$m US$m US$m
Cost
At 1 January 2008 ....................... 63 1,202 3,473 760 1,866 165 7,529
Additions1 ................................... – 158 764 118 169 23 1,232
Acquisition of subsidiaries ......... 10 – – 68 4 267 349
Disposals ..................................... – – (43) (26) (25) (3) (97)
Exchange differences .................. (8) – (561) (59) (264) (24) (916)
Other changes ............................. 2 – (204) 6 (1) (7) (204)
At 31 December 2008 ................. 67 1,360 3,429 867 1,749 421 7,893
Accumulated amortisation
At 1 January 2008 ....................... (44) (724) (2,167) (549) (541) (33) (4,058)
Charge for the year2 .................... (6) (299) (365) (114) (227) (20) (1,031)
Impairment .................................. – – – (1) – – (1)
Disposals ..................................... – – 18 6 10 – 34
Exchange differences .................. 5 – 311 36 80 1 433
Other changes ............................. – – 211 (9) (3) – 199
At 31 December 2008 ................. (45) (1,023) (1,992) (631) (681) (52) (4,424)
Net carrying amount at
31 December 2008 ................. 22 337 1,437 236 1,068 369 3,469
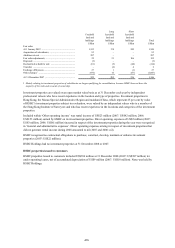
Cost
At 1 January 2007 ....................... 57 1,078 2,871 645 1,655 179 6,485
Additions1 ................................... – 124 587 104 140 6 961
Acquisition of subsidiaries ......... – – – – 4 – 4
Disposals ..................................... – – (7) (21) (6) (2) (36)
Exchange differences .................. 6 – 81 38 83 1 209
Other changes ............................. – – (59) (6) (10) (19) (94)
At 31 December 2007 ................. 63 1,202 3,473 760 1,866 165 7,529
Accumulated amortisation
At 1 January 2007 ....................... (21) (619) (1,772) (426) (320) (13) (3,171)
Charge for the year2 .................... (20) (108) (327) (120) (209) (21) (805)
Impairment .................................. – – (3) – – – (3)
Disposals ..................................... – – – 18 6 1 25
Exchange differences .................. (3) – (51) (25) (17) – (96)
Other changes ............................. – 3 (14) 4 (1) – (8)
At 31 December 2007 ................. (44) (724) (2,167) (549) (541) (33) (4,058)
Net carrying amount at
31 December 2007 .................
19 478 1,306 211
1,325
132 3,471
Net carrying amount at
1 January 2007 .......................
36 459 1,099 219
1,335
166 3,314
1 At 31 December 2008, HSBC had US$2 million (2007: US$47 million) of contractual commitments to acquire intangible assets.
2 The amortisation charge for the year is recognised within the income statement under ‘Amortisation and impairment of intangible
assets’, with the exception of the amortisation of mortgage servicing rights that is charged to net fee income.