HSBC 2008 Annual Report Download - page 127
Download and view the complete annual report
Please find page 127 of the 2008 HSBC annual report below. You can navigate through the pages in the report by either clicking on the pages listed below, or by using the keyword search tool below to find specific information within the annual report.-
 1
1 -
2
-
3
-
4
-
5
-
6
-
7
-
8
-
9
-
10
-
11
-
12
-
13
-
14
-
15
-
16
-
17
-
18
-
19
-
20
-
21
-
22
-
23
-
24
-
25
-
26
-
27
-
28
-
29
-
30
-
31
-
32
-
33
-
34
-
35
-
36
-
37
-
38
-
39
-
40
-
41
-
42
-
43
-
44
-
45
-
46
-
47
-
48
-
49
-
50
-
51
-
52
-
53
-
54
-
55
-
56
-
57
-
58
-
59
-
60
-
61
-
62
-
63
-
64
-
65
-
66
-
67
-
68
-
69
-
70
-
71
-
72
-
73
-
74
-
75
-
76
-
77
-
78
-
79
-
80
-
81
-
82
-
83
-
84
-
85
-
86
-
87
-
88
-
89
-
90
-
91
-
92
-
93
-
94
-
95
-
96
-
97
-
98
-
99
-
100
-
101
-
102
-
103
-
104
-
105
-
106
-
107
-
108
-
109
-
110
-
111
-
112
-
113
-
114
-
115
-
116
-
 117
117 -
 118
118 -
 119
119 -
 120
120 -
 121
121 -
 122
122 -
 123
123 -
 124
124 -
 125
125 -
 126
126 -
 127
127 -
 128
128 -
 129
129 -
 130
130 -
 131
131 -
 132
132 -
 133
133 -
 134
134 -
 135
135 -
 136
136 -
 137
137 -
138
-
139
-
140
-
141
-
142
-
143
-
144
-
145
-
146
-
147
-
148
-
149
-
150
-
151
-
152
-
153
-
154
-
155
-
156
-
157
-
158
-
159
-
160
-
161
-
162
-
163
-
164
-
165
-
166
-
167
-
168
-
169
-
170
-
171
-
172
-
173
-
174
-
175
-
176
-
177
-
178
-
179
-
180
-
181
-
182
-
183
-
184
-
185
-
186
-
187
-
188
-
189
-
190
-
191
-
192
-
193
-
194
-
195
-
196
-
197
-
198
-
199
-
200
-
201
-
202
-
203
-
204
-
205
-
206
-
207
-
208
-
209
-
210
-
211
-
212
-
213
-
214
-
215
-
216
-
217
-
218
-
219
-
220
-
221
-
222
-
223
-
224
-
225
-
226
-
227
-
228
-
229
-
230
-
231
-
232
-
233
-
234
-
235
-
236
-
237
-
238
-
239
-
240
-
241
-
242
-
243
-
244
-
245
-
246
-
247
-
248
-
249
-
250
-
251
-
252
-
253
-
254
-
255
-
256
-
257
-
258
-
259
-
260
-
261
-
262
-
263
-
264
-
265
-
266
-
267
-
268
-
269
-
270
-
271
-
272
-
273
-
274
-
275
-
276
-
277
-
278
-
279
-
280
-
281
-
282
-
283
-
284
-
285
-
286
-
287
-
288
-
289
-
290
-
291
-
292
-
293
-
294
-
295
-
296
-
297
-
298
-
299
-
300
-
301
-
302
-
303
-
304
-
305
-
306
-
307
-
308
-
309
-
310
-
311
-
312
-
313
-
314
-
315
-
316
-
317
-
318
-
319
-
320
-
321
-
322
-
323
-
324
-
325
-
326
-
327
-
328
-
329
-
330
-
331
-
332
-
333
-
334
-
335
-
336
-
337
-
338
-
339
-
340
-
341
-
342
-
343
-
344
-
345
-
346
-
347
-
348
-
349
-
350
-
351
-
352
-
353
-
354
-
355
-
356
-
357
-
358
-
359
-
360
-
361
-
362
-
363
-
364
-
365
-
366
-
367
-
368
-
369
-
370
-
371
-
372
-
373
-
374
-
375
-
376
-
377
-
378
-
379
-
380
-
381
-
382
-
383
-
384
-
385
-
386
-
387
-
388
-
389
-
390
-
391
-
392
-
393
-
394
-
395
-
396
-
397
-
398
-
399
-
400
-
401
-
402
-
403
-
404
-
405
-
406
-
407
-
408
-
409
-
410
-
411
-
412
-
413
-
414
-
415
-
416
-
417
-
418
-
419
-
420
-
421
-
422
-
423
-
424
-
425
-
426
-
427
-
428
-
429
-
430
-
431
-
432
-
433
-
434
-
435
-
436
-
437
-
438
-
439
-
440
-
441
-
442
-
443
-
444
-
445
-
446
-
447
-
448
-
449
-
450
-
451
-
452
-
453
-
454
-
455
-
456
-
457
-
458
-
459
-
460
-
461
-
462
-
463
-
464
-
465
-
466
-
467
-
468
-
469
-
470
-
471
-
472
 |
 |
125
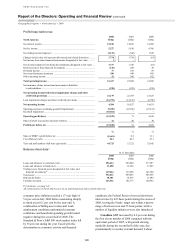
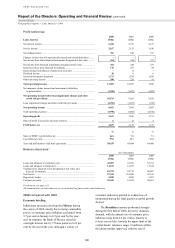
contrast, foreign exchange trading performance
was strong, supported by activity generated by a
weakening dollar and volatile markets.
Net income from financial instruments
designated at fair value rose to US$1.8 billion,
driven by significant fair value movements on
HSBC’s own debt as a result of the widening of
credit spreads and related derivatives in the second
half of the year.
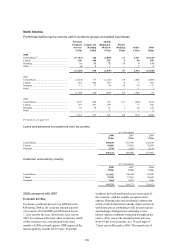
Gains less losses from financial investments of
US$245 million were primarily attributable to the
sale of shares in MasterCard.
Net earned insurance premiums decreased by
9 per cent to US$449 million, as the decline in loan
volumes led to a fall in credit insurance sales and
HSBC stopped reinsuring credit insurance for other
lenders.
Other operating income decreased significantly,
as higher losses were recorded on foreclosed
properties due to the combined effect of an increase
in the stock of such properties and a reduction in
their value due to falling prices. In addition, there
were lower gains on the sale of investments, mainly
due to a significant one-off gain in the latter part of
2006.
Net insurance claims incurred and movement in
liabilities to policyholders decreased by 7 per cent to
US$241 million, in line with the change in net
earned insurance premiums.
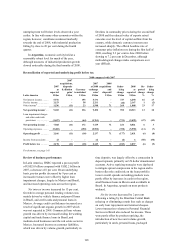
Loan impairment charges posted a steep rise,
increasing by 79 per cent to US$12.2 billion,
reflecting substantially higher charges in the US
consumer finance loan book, primarily in mortgage
lending but also in the credit cards portfolio in the
final part of the year. The main factor driving this
deterioration was the effect of the weaker housing
market on both economic activity and the ability of
borrowers to extend or refinance debt. In addition,
seasoning and mix change within the credit cards
portfolio and increases in bankruptcy filings after
the exceptionally low levels seen in 2006, following
changes in legislation, added to loan impairment
charges.
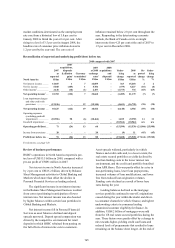
The real estate secured portfolios experienced
continuing deterioration in credit quality as a lack of
demand for securitised sub-prime mortgages and
falls in house prices severely restricted refinancing
options for many customers. Loan impairment
charges rose by 41 per cent to US$3.1 billion and by
139 per cent to US$4.1 billion in the mortgage
services business and consumer lending,
respectively. Delinquency rates exceeded recent
historical trends, particularly for those loans
originated in 2005 and 2006. Performance was
weakest in housing markets which had previously
experienced the steepest home price appreciation,
second lien products and stated income products.
US card services experienced a rise in loan
impairment charges from a combination of factors,
primarily a growth in balances, higher losses in the
final part of the year as the economy slowed, a rise
in bankruptcy rates to levels approaching those seen
historically, and a shift in portfolio mix towards non-
prime loans.
Loan impairment charges in Commercial
Banking rose by 151 per cent to US$191 million,
reflecting growth in the loan book, the increasing
probability of default among commercial real estate
loans in the US and a change in methodology for
determining loan impairment allowances on a
portfolio of revolving loans to small businesses. In
addition, in Canada, loan impairment charges
increased due to exposure to certain sectors affected
by the strength of the Canadian dollar and an
impairment charge for non-bank asset-backed
commercial paper was also taken.
Operating expenses increased by 3 per cent,
compared with growth in net operating income
before loan impairment charges of 5 per cent. The
retail bank branch network was extended both within
and beyond the Group’s traditional spheres of
operation to support the expansion of the Personal
Financial Services and Commercial Banking
businesses in the US and Canada. Premises and
equipment expenses rose as a consequence. The
consumer finance business incurred restructuring
charges from the discontinuation of the wholesale
and correspondent channels in mortgage services and
the closing of branch offices in consumer lending.
There were corresponding benefits in origination
costs. The Canadian consumer finance business was
also restructured in a similar fashion to the US. The
business incurred US$70 million of one-off costs
arising from the indemnification agreement with
Visa ahead of Visa’s planned IPO. In the cards and
consumer lending businesses, communication
expenses increased due to higher mailing volumes
on cards and consumer lending as credit collection
policies were tightened. In the third quarter,
however, expenditure on card marketing declined in
line with a decision to slow lending growth.
Share of profit in associates and joint ventures
declined to US$20 million.