HSBC 2008 Annual Report Download - page 226
Download and view the complete annual report
Please find page 226 of the 2008 HSBC annual report below. You can navigate through the pages in the report by either clicking on the pages listed below, or by using the keyword search tool below to find specific information within the annual report.-
 1
1 -
2
-
3
-
4
-
5
-
6
-
7
-
8
-
9
-
10
-
11
-
12
-
13
-
14
-
15
-
16
-
17
-
18
-
19
-
20
-
21
-
22
-
23
-
24
-
25
-
26
-
27
-
28
-
29
-
30
-
31
-
32
-
33
-
34
-
35
-
36
-
37
-
38
-
39
-
40
-
41
-
42
-
43
-
44
-
45
-
46
-
47
-
48
-
49
-
50
-
51
-
52
-
53
-
54
-
55
-
56
-
57
-
58
-
59
-
60
-
61
-
62
-
63
-
64
-
65
-
66
-
67
-
68
-
69
-
70
-
71
-
72
-
73
-
74
-
75
-
76
-
77
-
78
-
79
-
80
-
81
-
82
-
83
-
84
-
85
-
86
-
87
-
88
-
89
-
90
-
91
-
92
-
93
-
94
-
95
-
96
-
97
-
98
-
99
-
100
-
101
-
102
-
103
-
104
-
105
-
106
-
107
-
108
-
109
-
110
-
111
-
112
-
113
-
114
-
115
-
116
-
117
-
118
-
119
-
120
-
121
-
122
-
123
-
124
-
125
-
126
-
127
-
128
-
129
-
130
-
131
-
132
-
133
-
134
-
135
-
136
-
137
-
138
-
139
-
140
-
141
-
142
-
143
-
144
-
145
-
146
-
147
-
148
-
149
-
150
-
151
-
152
-
153
-
154
-
155
-
156
-
157
-
158
-
159
-
160
-
161
-
162
-
163
-
164
-
165
-
166
-
167
-
168
-
169
-
170
-
171
-
172
-
173
-
174
-
175
-
176
-
177
-
178
-
179
-
180
-
181
-
182
-
183
-
184
-
185
-
186
-
187
-
188
-
189
-
190
-
191
-
192
-
193
-
194
-
195
-
196
-
197
-
198
-
199
-
200
-
201
-
202
-
203
-
204
-
205
-
206
-
207
-
208
-
209
-
210
-
211
-
212
-
213
-
214
-
215
-
 216
216 -
 217
217 -
 218
218 -
 219
219 -
 220
220 -
 221
221 -
 222
222 -
 223
223 -
 224
224 -
 225
225 -
 226
226 -
 227
227 -
 228
228 -
 229
229 -
 230
230 -
 231
231 -
 232
232 -
 233
233 -
 234
234 -
 235
235 -
 236
236 -
237
-
238
-
239
-
240
-
241
-
242
-
243
-
244
-
245
-
246
-
247
-
248
-
249
-
250
-
251
-
252
-
253
-
254
-
255
-
256
-
257
-
258
-
259
-
260
-
261
-
262
-
263
-
264
-
265
-
266
-
267
-
268
-
269
-
270
-
271
-
272
-
273
-
274
-
275
-
276
-
277
-
278
-
279
-
280
-
281
-
282
-
283
-
284
-
285
-
286
-
287
-
288
-
289
-
290
-
291
-
292
-
293
-
294
-
295
-
296
-
297
-
298
-
299
-
300
-
301
-
302
-
303
-
304
-
305
-
306
-
307
-
308
-
309
-
310
-
311
-
312
-
313
-
314
-
315
-
316
-
317
-
318
-
319
-
320
-
321
-
322
-
323
-
324
-
325
-
326
-
327
-
328
-
329
-
330
-
331
-
332
-
333
-
334
-
335
-
336
-
337
-
338
-
339
-
340
-
341
-
342
-
343
-
344
-
345
-
346
-
347
-
348
-
349
-
350
-
351
-
352
-
353
-
354
-
355
-
356
-
357
-
358
-
359
-
360
-
361
-
362
-
363
-
364
-
365
-
366
-
367
-
368
-
369
-
370
-
371
-
372
-
373
-
374
-
375
-
376
-
377
-
378
-
379
-
380
-
381
-
382
-
383
-
384
-
385
-
386
-
387
-
388
-
389
-
390
-
391
-
392
-
393
-
394
-
395
-
396
-
397
-
398
-
399
-
400
-
401
-
402
-
403
-
404
-
405
-
406
-
407
-
408
-
409
-
410
-
411
-
412
-
413
-
414
-
415
-
416
-
417
-
418
-
419
-
420
-
421
-
422
-
423
-
424
-
425
-
426
-
427
-
428
-
429
-
430
-
431
-
432
-
433
-
434
-
435
-
436
-
437
-
438
-
439
-
440
-
441
-
442
-
443
-
444
-
445
-
446
-
447
-
448
-
449
-
450
-
451
-
452
-
453
-
454
-
455
-
456
-
457
-
458
-
459
-
460
-
461
-
462
-
463
-
464
-
465
-
466
-
467
-
468
-
469
-
470
-
471
-
472
 |
 |
HSBC HOLDINGS PLC
Report of the Directors: Risk (continued)
Credit risk > Impairment allowances > Movements
224
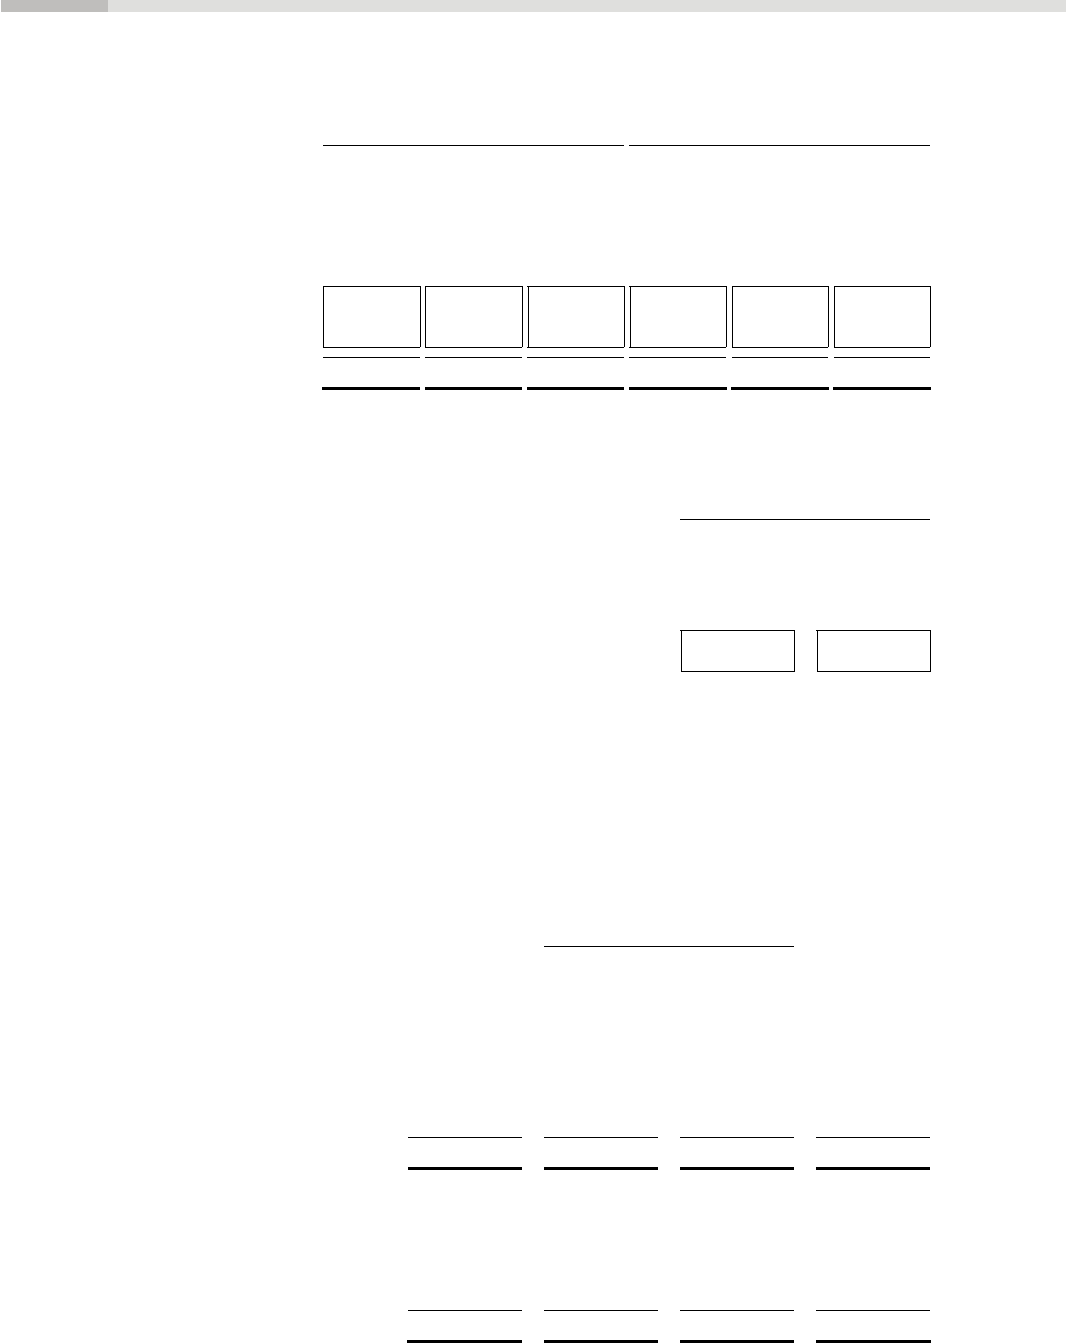
Impairment allowances on loans and advances to customers and banks by industry sector
(Audited)
At 31 December 2008 At 31 December 2007
Individually
assessed
allowances
Collectively
assessed
allowances
Total
allowances
Individually
assessed
allowances
Collectively
assessed
allowances
Total
allowances
US$m US$m US$m US$m US$m US$m
Banks1 ......................................................... 63 – 63 7 – 7
Customers ................................................... 3,284 20,625 23,909 2,699 16,506 19,205
Personal .................................................. 312 18,657 18,969 379 14,983 15,362
Corporate and commercial ..................... 2,845 1,795 4,640 2,275 1,472 3,747
Financial ................................................. 127 173 300 45 51 96
3,347 20,625 23,972 2,706 16,506 19,212
1 The impairment allowances on loans and advances to banks relates to the geographical region, Europe.
Impairment allowances as a percentage of loans and advances1
(Unaudited)
At 31 December
2008 2007
% %
Banks
Individually assessed impairment allowances2 ............................................................................. 0.06 0.0
Customers3 ......................................................................................................................................... 2.63 2.01
Individually assessed impairment allowances3 ............................................................................. 0.36 0.28
Collectively assessed impairment allowances3 ............................................................................. 2.27 1.73
1 Net of reverse repo transactions, settlement accounts and stock borrowings.
2 As a percentage of loans and advances to banks.
3 As a percentage of loans and advances to customers.
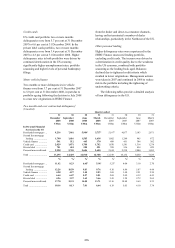
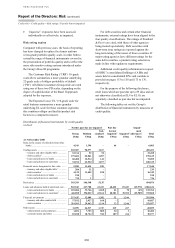
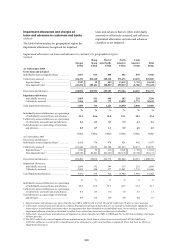
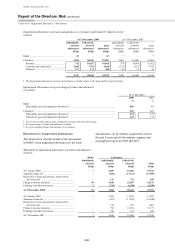
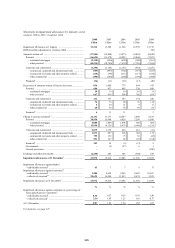
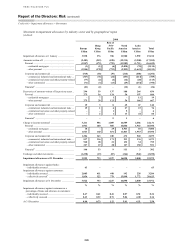
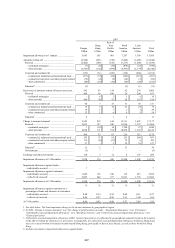
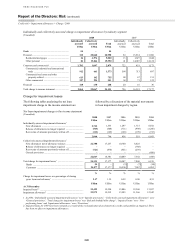
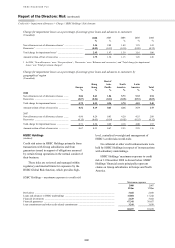
Movement in impairment allowances
The tables below describe details of the movements
in HSBC’s loan impairment allowances (i) for loans
and advances, (ii) by industry segment for each of
the past 5 years and (iii) by industry segment and
geographical region for 2008 and 2007.
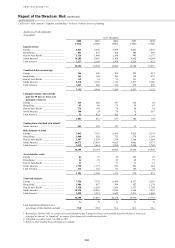
Movement in impairment allowances on loans and advances
(Audited)
Banks Customers
individually
assessed
Individually
assessed
Collectively
assessed Total
US$m US$m US$m US$m
At 1 January 2008 ......................................................... 7 2,699 16,506 19,212
Amounts written off ..................................................... – (824) (17,131) (17,955)
Recoveries of loans and advances written off in
previous years ......................................................... – 113 721 834
Charge to income statement ......................................... 54 2,010 22,067 24,131
Exchange and other movements ................................... 2 (714) (1,538) (2,250)
At 31 December 2008 .................................................. 63 3,284 20,625 23,972
At 1 January 2007 ......................................................... 7 2,565 11,013 13,585
Amounts written off ..................................................... – (897) (11,947) (12,844)
Recoveries of loans and advances written off in
previous years ......................................................... – 129 876 1,005
Charge to income statement ......................................... – 796 16,381 17,177
Exchange and other movements ................................... – 106 183 289
At 31 December 2007 ................................................... 7 2,699 16,506 19,212