HSBC 2008 Annual Report Download - page 62
Download and view the complete annual report
Please find page 62 of the 2008 HSBC annual report below. You can navigate through the pages in the report by either clicking on the pages listed below, or by using the keyword search tool below to find specific information within the annual report.-
 1
1 -
2
-
3
-
4
-
5
-
6
-
7
-
8
-
9
-
10
-
11
-
12
-
13
-
14
-
15
-
16
-
17
-
18
-
19
-
20
-
21
-
22
-
23
-
24
-
25
-
26
-
27
-
28
-
29
-
30
-
31
-
32
-
33
-
34
-
35
-
36
-
37
-
38
-
39
-
40
-
41
-
42
-
43
-
44
-
45
-
46
-
47
-
48
-
49
-
50
-
51
-
 52
52 -
 53
53 -
 54
54 -
 55
55 -
 56
56 -
 57
57 -
 58
58 -
 59
59 -
 60
60 -
 61
61 -
 62
62 -
 63
63 -
 64
64 -
 65
65 -
 66
66 -
 67
67 -
 68
68 -
 69
69 -
 70
70 -
 71
71 -
 72
72 -
73
-
74
-
75
-
76
-
77
-
78
-
79
-
80
-
81
-
82
-
83
-
84
-
85
-
86
-
87
-
88
-
89
-
90
-
91
-
92
-
93
-
94
-
95
-
96
-
97
-
98
-
99
-
100
-
101
-
102
-
103
-
104
-
105
-
106
-
107
-
108
-
109
-
110
-
111
-
112
-
113
-
114
-
115
-
116
-
117
-
118
-
119
-
120
-
121
-
122
-
123
-
124
-
125
-
126
-
127
-
128
-
129
-
130
-
131
-
132
-
133
-
134
-
135
-
136
-
137
-
138
-
139
-
140
-
141
-
142
-
143
-
144
-
145
-
146
-
147
-
148
-
149
-
150
-
151
-
152
-
153
-
154
-
155
-
156
-
157
-
158
-
159
-
160
-
161
-
162
-
163
-
164
-
165
-
166
-
167
-
168
-
169
-
170
-
171
-
172
-
173
-
174
-
175
-
176
-
177
-
178
-
179
-
180
-
181
-
182
-
183
-
184
-
185
-
186
-
187
-
188
-
189
-
190
-
191
-
192
-
193
-
194
-
195
-
196
-
197
-
198
-
199
-
200
-
201
-
202
-
203
-
204
-
205
-
206
-
207
-
208
-
209
-
210
-
211
-
212
-
213
-
214
-
215
-
216
-
217
-
218
-
219
-
220
-
221
-
222
-
223
-
224
-
225
-
226
-
227
-
228
-
229
-
230
-
231
-
232
-
233
-
234
-
235
-
236
-
237
-
238
-
239
-
240
-
241
-
242
-
243
-
244
-
245
-
246
-
247
-
248
-
249
-
250
-
251
-
252
-
253
-
254
-
255
-
256
-
257
-
258
-
259
-
260
-
261
-
262
-
263
-
264
-
265
-
266
-
267
-
268
-
269
-
270
-
271
-
272
-
273
-
274
-
275
-
276
-
277
-
278
-
279
-
280
-
281
-
282
-
283
-
284
-
285
-
286
-
287
-
288
-
289
-
290
-
291
-
292
-
293
-
294
-
295
-
296
-
297
-
298
-
299
-
300
-
301
-
302
-
303
-
304
-
305
-
306
-
307
-
308
-
309
-
310
-
311
-
312
-
313
-
314
-
315
-
316
-
317
-
318
-
319
-
320
-
321
-
322
-
323
-
324
-
325
-
326
-
327
-
328
-
329
-
330
-
331
-
332
-
333
-
334
-
335
-
336
-
337
-
338
-
339
-
340
-
341
-
342
-
343
-
344
-
345
-
346
-
347
-
348
-
349
-
350
-
351
-
352
-
353
-
354
-
355
-
356
-
357
-
358
-
359
-
360
-
361
-
362
-
363
-
364
-
365
-
366
-
367
-
368
-
369
-
370
-
371
-
372
-
373
-
374
-
375
-
376
-
377
-
378
-
379
-
380
-
381
-
382
-
383
-
384
-
385
-
386
-
387
-
388
-
389
-
390
-
391
-
392
-
393
-
394
-
395
-
396
-
397
-
398
-
399
-
400
-
401
-
402
-
403
-
404
-
405
-
406
-
407
-
408
-
409
-
410
-
411
-
412
-
413
-
414
-
415
-
416
-
417
-
418
-
419
-
420
-
421
-
422
-
423
-
424
-
425
-
426
-
427
-
428
-
429
-
430
-
431
-
432
-
433
-
434
-
435
-
436
-
437
-
438
-
439
-
440
-
441
-
442
-
443
-
444
-
445
-
446
-
447
-
448
-
449
-
450
-
451
-
452
-
453
-
454
-
455
-
456
-
457
-
458
-
459
-
460
-
461
-
462
-
463
-
464
-
465
-
466
-
467
-
468
-
469
-
470
-
471
-
472
 |
 |

HSBC HOLDINGS PLC
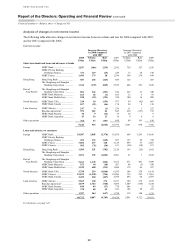
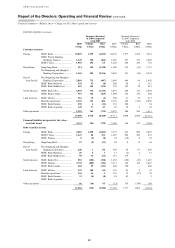
Report of the Directors: Operating and Financial Review (continued)
Financial summary > Balance sheet > Deposits / CDs // Critical accounting policies
60
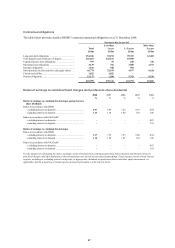
2008 2007 2006
Average
balance
Average
rate
Average
balance
Average
rate
Average
balance
Average
rate
US$m % US$m % US$m %
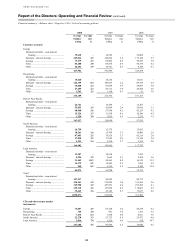
Customer accounts
Europe
Demand and other – non-interest
bearing ................................................ 39,610
–
34,585 –
33,000 –
Demand – interest bearing ..................... 225,034 2.9 210,692 3.5 173,150 2.7
Savings ................................................... 73,479 4.3 62,002 4.6 50,525 3.9
Time ........................................................ 83,208 3.8 69,476 4.9 59,374 4.2
Other ....................................................... 26,651 3.9 14,741 4.5 9,249 4.1
447,982 391,496 325,298
Hong Kong
Demand and other – non-interest
bearing ................................................ 15,620
–
14,214 –
13,011 –
Demand – interest bearing ..................... 126,199 0.4 107,053 2.2 88,754 2.4
Savings ................................................... 65,068 2.4 63,649 3.9 58,883 3.8
Time ........................................................ 27,659 2.3 26,712 3.9 20,454 3.6
Other ....................................................... 1,563 1.2 1,164 4.3 51 3.9
236,109 212,792 181,153
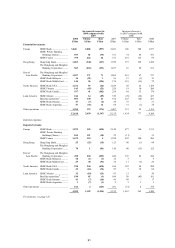
Rest of Asia-Pacific
Demand and other – non-interest
bearing ................................................ 22,721
–
16,438 –
13,107 –
Demand – interest bearing ..................... 55,653 1.9 41,089 2.4 29,816 2.1
Savings ................................................... 68,968 3.6 57,950 4.2 42,153 4.3
Time ........................................................ 15,226 3.3 11,538 4.6 10,246 4.5
Other ....................................................... 1,359 2.8 1,835 4.5 2,233 3.5
163,927 128,850 97,555
North America
Demand and other – non-interest
bearing ................................................ 16,759
–
15,175 –
13,662 –
Demand – interest bearing ..................... 18,261 1.6 15,389 3.3 14,406 2.9
Savings ................................................... 87,001 2.5 79,529 3.3 65,216 2.8
Time ........................................................ 17,838 3.2 17,655 5.9 21,124 5.4
Other ....................................................... 5,123 2.4 3,234 3.7 3,339 2.0
144,982 130,982 117,747
Latin America
Demand and other – non-interest
bearing ................................................ 12,507
–
10,530 –
7,995 –
Demand – interest bearing ..................... 4,994 1.9 5,662 2.1 5,438 1.6
Savings ................................................... 31,442 10.3 24,861 8.8 16,512 11.3
Time ........................................................ 15,179 5.2 12,443 5.9 7,665 5.9
Other ....................................................... 949 8.2 1,212 9.5 2,145 13.4
65,071 54,708 39,755
Total
Demand and other – non-interest
bearing ................................................ 107,217
–
90,942 –
80,775 –
Demand – interest bearing ..................... 430,141 1.9 379,885 3.0 311,564 2.6
Savings ................................................... 325,958 3.9 287,991 4.4 233,289 4.1
Time ........................................................ 159,110 3.6 137,824 4.9 118,863 4.5
Other ....................................................... 35,645 3.6 22,186 4.7 17,017 4.8
1,058,071 918,828 761,508
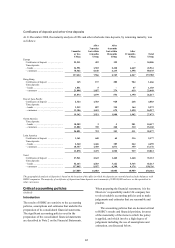
CDs and other money market
instruments
Europe ......................................................... 74,007 4.5 66,164 5.0 48,238 4.2
Hong Kong ................................................. 745 3.0 941 3.9 1,191 3.5
Rest of Asia-Pacific .................................... 7,614 6.4 7,230 6.0 6,621 5.6
North America ............................................ 22,278 3.3 23,735 5.4 23,472 4.6
Latin America ............................................. 3,036 7.8 1,526 6.8 318 10.7
107,680 4.5 99,596 5.2 79,840 4.5