HSBC 2008 Annual Report Download - page 73
Download and view the complete annual report
Please find page 73 of the 2008 HSBC annual report below. You can navigate through the pages in the report by either clicking on the pages listed below, or by using the keyword search tool below to find specific information within the annual report.-
 1
1 -
2
-
3
-
4
-
5
-
6
-
7
-
8
-
9
-
10
-
11
-
12
-
13
-
14
-
15
-
16
-
17
-
18
-
19
-
20
-
21
-
22
-
23
-
24
-
25
-
26
-
27
-
28
-
29
-
30
-
31
-
32
-
33
-
34
-
35
-
36
-
37
-
38
-
39
-
40
-
41
-
42
-
43
-
44
-
45
-
46
-
47
-
48
-
49
-
50
-
51
-
52
-
53
-
54
-
55
-
56
-
57
-
58
-
59
-
60
-
61
-
62
-
 63
63 -
 64
64 -
 65
65 -
 66
66 -
 67
67 -
 68
68 -
 69
69 -
 70
70 -
 71
71 -
 72
72 -
 73
73 -
 74
74 -
 75
75 -
 76
76 -
 77
77 -
 78
78 -
 79
79 -
 80
80 -
 81
81 -
 82
82 -
 83
83 -
84
-
85
-
86
-
87
-
88
-
89
-
90
-
91
-
92
-
93
-
94
-
95
-
96
-
97
-
98
-
99
-
100
-
101
-
102
-
103
-
104
-
105
-
106
-
107
-
108
-
109
-
110
-
111
-
112
-
113
-
114
-
115
-
116
-
117
-
118
-
119
-
120
-
121
-
122
-
123
-
124
-
125
-
126
-
127
-
128
-
129
-
130
-
131
-
132
-
133
-
134
-
135
-
136
-
137
-
138
-
139
-
140
-
141
-
142
-
143
-
144
-
145
-
146
-
147
-
148
-
149
-
150
-
151
-
152
-
153
-
154
-
155
-
156
-
157
-
158
-
159
-
160
-
161
-
162
-
163
-
164
-
165
-
166
-
167
-
168
-
169
-
170
-
171
-
172
-
173
-
174
-
175
-
176
-
177
-
178
-
179
-
180
-
181
-
182
-
183
-
184
-
185
-
186
-
187
-
188
-
189
-
190
-
191
-
192
-
193
-
194
-
195
-
196
-
197
-
198
-
199
-
200
-
201
-
202
-
203
-
204
-
205
-
206
-
207
-
208
-
209
-
210
-
211
-
212
-
213
-
214
-
215
-
216
-
217
-
218
-
219
-
220
-
221
-
222
-
223
-
224
-
225
-
226
-
227
-
228
-
229
-
230
-
231
-
232
-
233
-
234
-
235
-
236
-
237
-
238
-
239
-
240
-
241
-
242
-
243
-
244
-
245
-
246
-
247
-
248
-
249
-
250
-
251
-
252
-
253
-
254
-
255
-
256
-
257
-
258
-
259
-
260
-
261
-
262
-
263
-
264
-
265
-
266
-
267
-
268
-
269
-
270
-
271
-
272
-
273
-
274
-
275
-
276
-
277
-
278
-
279
-
280
-
281
-
282
-
283
-
284
-
285
-
286
-
287
-
288
-
289
-
290
-
291
-
292
-
293
-
294
-
295
-
296
-
297
-
298
-
299
-
300
-
301
-
302
-
303
-
304
-
305
-
306
-
307
-
308
-
309
-
310
-
311
-
312
-
313
-
314
-
315
-
316
-
317
-
318
-
319
-
320
-
321
-
322
-
323
-
324
-
325
-
326
-
327
-
328
-
329
-
330
-
331
-
332
-
333
-
334
-
335
-
336
-
337
-
338
-
339
-
340
-
341
-
342
-
343
-
344
-
345
-
346
-
347
-
348
-
349
-
350
-
351
-
352
-
353
-
354
-
355
-
356
-
357
-
358
-
359
-
360
-
361
-
362
-
363
-
364
-
365
-
366
-
367
-
368
-
369
-
370
-
371
-
372
-
373
-
374
-
375
-
376
-
377
-
378
-
379
-
380
-
381
-
382
-
383
-
384
-
385
-
386
-
387
-
388
-
389
-
390
-
391
-
392
-
393
-
394
-
395
-
396
-
397
-
398
-
399
-
400
-
401
-
402
-
403
-
404
-
405
-
406
-
407
-
408
-
409
-
410
-
411
-
412
-
413
-
414
-
415
-
416
-
417
-
418
-
419
-
420
-
421
-
422
-
423
-
424
-
425
-
426
-
427
-
428
-
429
-
430
-
431
-
432
-
433
-
434
-
435
-
436
-
437
-
438
-
439
-
440
-
441
-
442
-
443
-
444
-
445
-
446
-
447
-
448
-
449
-
450
-
451
-
452
-
453
-
454
-
455
-
456
-
457
-
458
-
459
-
460
-
461
-
462
-
463
-
464
-
465
-
466
-
467
-
468
-
469
-
470
-
471
-
472
 |
 |

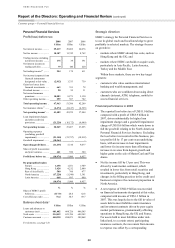
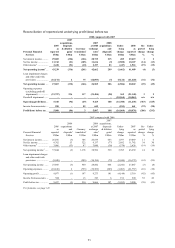
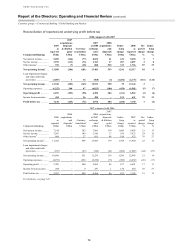
71
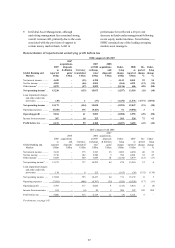
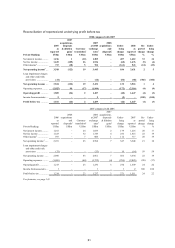
Reconciliation of reported and underlying profit/(loss) before tax
2008 compared with 2007
Personal Financial
Services
2007
as
reported
US$m
2007
acquisitions,
disposals
& dilution
gains1
US$m
Currency
translation2
US$m
2007
at 2008
exchange
rates3
US$m
2008
acquisitions
and
disposals1
US$m
Under-
lying
change
US$m
2008
as
reported
US$m
Re-
ported
change
%
Under-
lying
change
%
Net interest income .......... 29,069 (224) (126) 28,719 215 485 29,419 1 2
Net fee income ................. 11,742 (21) (105) 11,616 (9) (1,500) 10,107 (14) (13)
Other income4 .................. 2,428 (91) (10) 2,327 83 (447) 1,963 (19) (19)
Net operating income5 ... 43,239 (336) (241) 42,662 289 (1,462) 41,489 (4) (3)
Loan impairment charges
and other credit risk
provisions .................... (16,172) 4 75 (16,093) (3) (5,124) (21,220) (31) (32)
Net operating income .... 27,067 (332) (166) 26,569 286 (6,586) 20,269 (25) (25)
Operating expenses
(excluding goodwill
impairment) ................. (21,757) 236 117 (21,404) (98) 362 (21,140) 3 2
Goodwill impairment ....... – – – – – (10,564) (10,564) n/a n/a
Operating profit/(loss) ... 5,310 (96) (49) 5,165 188 (16,788) (11,435) (315) (325)
Income from associates ... 590 – 52 642 – (181) 461 (22) (28)
Profit/(loss) before tax ... 5,900 (96) 3 5,807 188 (16,969) (10,974) (286) (292)
2007 compared with 2006
Personal Financial
Services
2006
as
reported
US$m
2006
acquisitions
and
disposals1
US$m
Currency
translation2
US$m
2006
at 2007
exchange
rates6
US$m
2007
acquisitions,
disposals
& dilution
gains1
US$m
Under-
lying
change
US$m
2007
as
reported
US$m
Re-
ported
change
%
Under-
lying
change
%
Net interest income .......... 26,076 (3) 746 26,819 653 1,597 29,069 11 6
Net fee income ................. 8,762 53 322 9,137 (77) 2,682 11,742 34 30
Other income4 .................. 3,006 (53) 87 3,040 (38) (574) 2,428 (19) (19)
Net operating income5 ..... 37,844 (3) 1,155 38,996 538 3,705 43,239 14 10
Loan impairment charges
and other credit risk
provisions .................... (9,949) – (205) (10,154) (72) (5,946) (16,172) (63) (59)
Net operating income ...... 27,895 (3) 950 28,842 466 (2,241) 27,067 (3) (8)
Operating expenses .......... (18,818) 2 (753) (19,569) (285) (1,903) (21,757) (16) (10)
Operating profit ............... 9,077 (1) 197 9,273 181 (4,144) 5,310 (42) (45)
Income from associates ... 380 – 13 393 6 191 590 55 49
Profit before tax ............... 9,457 (1) 210 9,666 187 (3,953) 5,900 (38) (41)
For footnotes, see page 143.