HSBC 2008 Annual Report Download - page 338
Download and view the complete annual report
Please find page 338 of the 2008 HSBC annual report below. You can navigate through the pages in the report by either clicking on the pages listed below, or by using the keyword search tool below to find specific information within the annual report.-
 1
1 -
2
-
3
-
4
-
5
-
6
-
7
-
8
-
9
-
10
-
11
-
12
-
13
-
14
-
15
-
16
-
17
-
18
-
19
-
20
-
21
-
22
-
23
-
24
-
25
-
26
-
27
-
28
-
29
-
30
-
31
-
32
-
33
-
34
-
35
-
36
-
37
-
38
-
39
-
40
-
41
-
42
-
43
-
44
-
45
-
46
-
47
-
48
-
49
-
50
-
51
-
52
-
53
-
54
-
55
-
56
-
57
-
58
-
59
-
60
-
61
-
62
-
63
-
64
-
65
-
66
-
67
-
68
-
69
-
70
-
71
-
72
-
73
-
74
-
75
-
76
-
77
-
78
-
79
-
80
-
81
-
82
-
83
-
84
-
85
-
86
-
87
-
88
-
89
-
90
-
91
-
92
-
93
-
94
-
95
-
96
-
97
-
98
-
99
-
100
-
101
-
102
-
103
-
104
-
105
-
106
-
107
-
108
-
109
-
110
-
111
-
112
-
113
-
114
-
115
-
116
-
117
-
118
-
119
-
120
-
121
-
122
-
123
-
124
-
125
-
126
-
127
-
128
-
129
-
130
-
131
-
132
-
133
-
134
-
135
-
136
-
137
-
138
-
139
-
140
-
141
-
142
-
143
-
144
-
145
-
146
-
147
-
148
-
149
-
150
-
151
-
152
-
153
-
154
-
155
-
156
-
157
-
158
-
159
-
160
-
161
-
162
-
163
-
164
-
165
-
166
-
167
-
168
-
169
-
170
-
171
-
172
-
173
-
174
-
175
-
176
-
177
-
178
-
179
-
180
-
181
-
182
-
183
-
184
-
185
-
186
-
187
-
188
-
189
-
190
-
191
-
192
-
193
-
194
-
195
-
196
-
197
-
198
-
199
-
200
-
201
-
202
-
203
-
204
-
205
-
206
-
207
-
208
-
209
-
210
-
211
-
212
-
213
-
214
-
215
-
216
-
217
-
218
-
219
-
220
-
221
-
222
-
223
-
224
-
225
-
226
-
227
-
228
-
229
-
230
-
231
-
232
-
233
-
234
-
235
-
236
-
237
-
238
-
239
-
240
-
241
-
242
-
243
-
244
-
245
-
246
-
247
-
248
-
249
-
250
-
251
-
252
-
253
-
254
-
255
-
256
-
257
-
258
-
259
-
260
-
261
-
262
-
263
-
264
-
265
-
266
-
267
-
268
-
269
-
270
-
271
-
272
-
273
-
274
-
275
-
276
-
277
-
278
-
279
-
280
-
281
-
282
-
283
-
284
-
285
-
286
-
287
-
288
-
289
-
290
-
291
-
292
-
293
-
294
-
295
-
296
-
297
-
298
-
299
-
300
-
301
-
302
-
303
-
304
-
305
-
306
-
307
-
308
-
309
-
310
-
311
-
312
-
313
-
314
-
315
-
316
-
317
-
318
-
319
-
320
-
321
-
322
-
323
-
324
-
325
-
326
-
327
-
 328
328 -
 329
329 -
 330
330 -
 331
331 -
 332
332 -
 333
333 -
 334
334 -
 335
335 -
 336
336 -
 337
337 -
 338
338 -
 339
339 -
 340
340 -
 341
341 -
 342
342 -
 343
343 -
 344
344 -
 345
345 -
 346
346 -
 347
347 -
 348
348 -
349
-
350
-
351
-
352
-
353
-
354
-
355
-
356
-
357
-
358
-
359
-
360
-
361
-
362
-
363
-
364
-
365
-
366
-
367
-
368
-
369
-
370
-
371
-
372
-
373
-
374
-
375
-
376
-
377
-
378
-
379
-
380
-
381
-
382
-
383
-
384
-
385
-
386
-
387
-
388
-
389
-
390
-
391
-
392
-
393
-
394
-
395
-
396
-
397
-
398
-
399
-
400
-
401
-
402
-
403
-
404
-
405
-
406
-
407
-
408
-
409
-
410
-
411
-
412
-
413
-
414
-
415
-
416
-
417
-
418
-
419
-
420
-
421
-
422
-
423
-
424
-
425
-
426
-
427
-
428
-
429
-
430
-
431
-
432
-
433
-
434
-
435
-
436
-
437
-
438
-
439
-
440
-
441
-
442
-
443
-
444
-
445
-
446
-
447
-
448
-
449
-
450
-
451
-
452
-
453
-
454
-
455
-
456
-
457
-
458
-
459
-
460
-
461
-
462
-
463
-
464
-
465
-
466
-
467
-
468
-
469
-
470
-
471
-
472
 |
 |

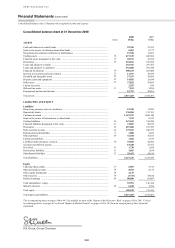
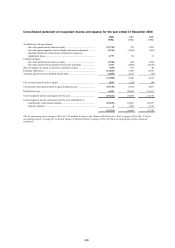
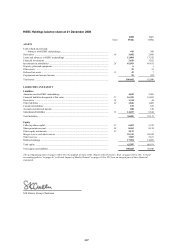
HSBC HOLDINGS PLC
Financial Statements (continued)
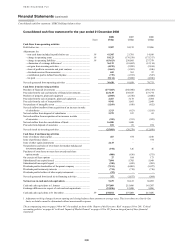
Consolidated cash flow statement / HSBC Holdings balance sheet
336
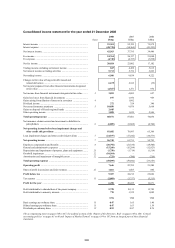
Consolidated cash flow statement for the year ended 31 December 2008
2008 2007 2006
Notes US$m US$m US$m
Cash flows from operating activities
Profit before tax ...................................................................................... 9,307 24,212 22,086
Adjustments for:
– non-cash items included in profit before tax .................................. 39 41,305 21,701 14,956
– change in operating assets ............................................................... 39 18,123 (176,538) (175,317)
– change in operating liabilities ......................................................... 39 (63,413) 250,095 237,378
– elimination of exchange differences1 .............................................. 36,132 (18,602) (12,114)
– net gain from investing activities .................................................... (4,195) (2,209) (2,014)
– share of profits in associates and joint ventures ............................. (1,661) (1,503) (846)
– dividends received from associates ................................................. 655 363 97
– contribution paid to defined benefit plans ...................................... (719) (1,393) (547)
– tax paid ............................................................................................ (5,114) (5,088) (4,946)
Net cash generated from operating activities ......................................... 30,420 91,038 78,733
Cash flows from investing activities
Purchase of financial investments .......................................................... (277,023) (260,980) (286,316)
Proceeds from the sale and maturity of financial investments .............. 223,138 238,647 273,774
Purchase of property, plant and equipment ............................................ (2,985) (2,720) (2,400)
Proceeds from the sale of property, plant and equipment ...................... 2,467 3,178 2,504
Proceeds from the sale of loan portfolios ............................................... 9,941 1,665 2,048
Net purchase of intangible assets ........................................................... (1,169) (950) (852)
Net cash inflow/(outflow) from acquisition of an increase in stake
of subsidiaries ..................................................................................... 1,313 (623) (1,185)
Net cash inflow from disposal of subsidiaries ....................................... 2,979 187 62
Net cash outflow from acquisition of an increase in stake
of associates ........................................................................................ (355) (351) (585)
Net cash inflow from the consolidation of funds ................................... 16,500 1,600 –
Proceeds from disposal of associates ..................................................... 101 69 874
Net cash (used in) investing activities .................................................... (25,093) (20,278) (12,076)
Cash flows from financing activities
Issue of ordinary share capital ................................................................ 467 474 1,010
Issue of preference shares ....................................................................... – – 374
Issue of other equity instruments ........................................................... 2,133 – –
Net purchases and sales of own shares for market-making and
investment purposes ........................................................................... (194) 126 46
Purchases of own shares to meet share awards and share
option awards ..................................................................................... (808) (636) (575)
On exercise of share options .................................................................. 27 104 173
Subordinated loan capital issued ............................................................ 7,094 5,705 5,948
Subordinated loan capital repaid ............................................................ (350) (689) (903)
Dividends paid to shareholders of the parent company ......................... (7,211) (6,003) (5,927)
Dividends paid to minority interests ...................................................... (714) (718) (710)
Dividends paid to holders of other equity instruments .......................... (92) – –
Net cash generated from/(used in) in financing activities ..................... 352 (1,637) (564)
Net increase in cash and cash equivalents .......................................... 5,679 69,123 66,093
Cash and cash equivalents at 1 January ................................................. 297,009 215,486 141,307
Exchange differences in respect of cash and cash equivalents .............. (23,816) 12,400 8,086
Cash and cash equivalents at 31 December ........................................... 39 278,872 297,009 215,486
1 Adjustment to bring changes between opening and closing balance sheet amounts to average rates. This is not done on a line-by-line
basis, as details cannot be determined without unreasonable expense.
The accompanying notes on pages 340 to 447, the audited sections of the ‘Report of the Directors: Risk’ on pages 188 to 280, ‘Critical
accounting policies’ on pages 61 to 66 and ‘Impact of Market Turmoil’ on pages 144 to 187 form an integral part of these financial
statements.