HSBC 2008 Annual Report Download - page 20
Download and view the complete annual report
Please find page 20 of the 2008 HSBC annual report below. You can navigate through the pages in the report by either clicking on the pages listed below, or by using the keyword search tool below to find specific information within the annual report.-
 1
1 -
2
-
3
-
4
-
5
-
6
-
7
-
8
-
9
-
 10
10 -
 11
11 -
 12
12 -
 13
13 -
 14
14 -
 15
15 -
 16
16 -
 17
17 -
 18
18 -
 19
19 -
 20
20 -
 21
21 -
 22
22 -
 23
23 -
 24
24 -
 25
25 -
 26
26 -
 27
27 -
 28
28 -
 29
29 -
 30
30 -
31
-
32
-
33
-
34
-
35
-
36
-
37
-
38
-
39
-
40
-
41
-
42
-
43
-
44
-
45
-
46
-
47
-
48
-
49
-
50
-
51
-
52
-
53
-
54
-
55
-
56
-
57
-
58
-
59
-
60
-
61
-
62
-
63
-
64
-
65
-
66
-
67
-
68
-
69
-
70
-
71
-
72
-
73
-
74
-
75
-
76
-
77
-
78
-
79
-
80
-
81
-
82
-
83
-
84
-
85
-
86
-
87
-
88
-
89
-
90
-
91
-
92
-
93
-
94
-
95
-
96
-
97
-
98
-
99
-
100
-
101
-
102
-
103
-
104
-
105
-
106
-
107
-
108
-
109
-
110
-
111
-
112
-
113
-
114
-
115
-
116
-
117
-
118
-
119
-
120
-
121
-
122
-
123
-
124
-
125
-
126
-
127
-
128
-
129
-
130
-
131
-
132
-
133
-
134
-
135
-
136
-
137
-
138
-
139
-
140
-
141
-
142
-
143
-
144
-
145
-
146
-
147
-
148
-
149
-
150
-
151
-
152
-
153
-
154
-
155
-
156
-
157
-
158
-
159
-
160
-
161
-
162
-
163
-
164
-
165
-
166
-
167
-
168
-
169
-
170
-
171
-
172
-
173
-
174
-
175
-
176
-
177
-
178
-
179
-
180
-
181
-
182
-
183
-
184
-
185
-
186
-
187
-
188
-
189
-
190
-
191
-
192
-
193
-
194
-
195
-
196
-
197
-
198
-
199
-
200
-
201
-
202
-
203
-
204
-
205
-
206
-
207
-
208
-
209
-
210
-
211
-
212
-
213
-
214
-
215
-
216
-
217
-
218
-
219
-
220
-
221
-
222
-
223
-
224
-
225
-
226
-
227
-
228
-
229
-
230
-
231
-
232
-
233
-
234
-
235
-
236
-
237
-
238
-
239
-
240
-
241
-
242
-
243
-
244
-
245
-
246
-
247
-
248
-
249
-
250
-
251
-
252
-
253
-
254
-
255
-
256
-
257
-
258
-
259
-
260
-
261
-
262
-
263
-
264
-
265
-
266
-
267
-
268
-
269
-
270
-
271
-
272
-
273
-
274
-
275
-
276
-
277
-
278
-
279
-
280
-
281
-
282
-
283
-
284
-
285
-
286
-
287
-
288
-
289
-
290
-
291
-
292
-
293
-
294
-
295
-
296
-
297
-
298
-
299
-
300
-
301
-
302
-
303
-
304
-
305
-
306
-
307
-
308
-
309
-
310
-
311
-
312
-
313
-
314
-
315
-
316
-
317
-
318
-
319
-
320
-
321
-
322
-
323
-
324
-
325
-
326
-
327
-
328
-
329
-
330
-
331
-
332
-
333
-
334
-
335
-
336
-
337
-
338
-
339
-
340
-
341
-
342
-
343
-
344
-
345
-
346
-
347
-
348
-
349
-
350
-
351
-
352
-
353
-
354
-
355
-
356
-
357
-
358
-
359
-
360
-
361
-
362
-
363
-
364
-
365
-
366
-
367
-
368
-
369
-
370
-
371
-
372
-
373
-
374
-
375
-
376
-
377
-
378
-
379
-
380
-
381
-
382
-
383
-
384
-
385
-
386
-
387
-
388
-
389
-
390
-
391
-
392
-
393
-
394
-
395
-
396
-
397
-
398
-
399
-
400
-
401
-
402
-
403
-
404
-
405
-
406
-
407
-
408
-
409
-
410
-
411
-
412
-
413
-
414
-
415
-
416
-
417
-
418
-
419
-
420
-
421
-
422
-
423
-
424
-
425
-
426
-
427
-
428
-
429
-
430
-
431
-
432
-
433
-
434
-
435
-
436
-
437
-
438
-
439
-
440
-
441
-
442
-
443
-
444
-
445
-
446
-
447
-
448
-
449
-
450
-
451
-
452
-
453
-
454
-
455
-
456
-
457
-
458
-
459
-
460
-
461
-
462
-
463
-
464
-
465
-
466
-
467
-
468
-
469
-
470
-
471
-
472
 |
 |

HSBC HOLDINGS PLC
Report of the Directors: Operating and Financial Review (continued)
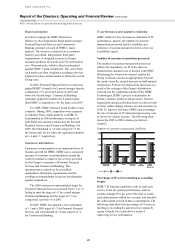
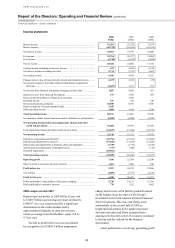
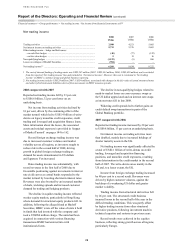
KPIs
18
Financial KPIs – trend analysis
2008 2007 2006 2005 2004
% % % % %
Revenue growth1 ..................................................................... 3.4 20.8 13.4 12.2 –
Revenue mix2
Net interest income ............................................................. 52.1 47.8 52.8 54.4 60.6
Net fee income .................................................................... 24.5 27.9 26.3 25.1 25.2
Other income3 ..................................................................... 23.4 24.3 20.9 20.5 14.2
Cost efficiency4
– reported ............................................................................ 60.1 49.4 51.3 51.2 51.6
– excluding goodwill impairment ...................................... 47.2 49.4 51.3 51.2 51.6
Credit performance as measured by risk adjusted margin5 .... 4.8 6.0 6.3 6.3 6.8
Return on average invested capital6 ....................................... 4.0 15.3 14.9 15.9 15.0
Dividends per share growth7 ................................................... (28.9) 11.1 11.0 10.6 10.0
Basic earnings per ordinary share8
– reported (US$) ................................................................. 0.47 1.65 1.40 1.36 1.18
– excluding goodwill impairment (US$) ........................... 1.36 1.65 1.40 1.36 1.18
Return on average total shareholders’ equity9 ........................ 4.7 15.9 15.7 16.8 16.3
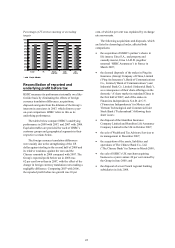
Over Over Over
1 year 3 years 5 years
Total shareholder return
HSBC TSR ........................... 84.5 84.5 98.5
Benchmarks:
– FTSE 100 ...................... 71.7 88.1 118.3
– MSCI World ................. 81.8 93.6 123.7
– MSCI Banks ................. 63.0 60.8 82.7
1 The percentage increase in net operating income before loan impairment and other credit risk charges since the previous year.
2 As a percentage of net operating income before loan impairment charges and other credit risk provisions.
3 Other income comprises net operating income before loan impairment charges and other credit risk provisions less net interest income
and net fee income.
4 Total operating expenses divided by net operating income before loan impairment and other credit risk charges.
5 Net operating income divided by average risk-weighted assets.
6 Profit attributable to ordinary shareholders divided by average invested capital.
7 The percentage increase in dividends per share since the previous year, based on the dividends paid in respect of the year to which the
dividend relates.
8 Basic earnings per ordinary share is defined in Note 13 on the Financial Statements.
9 The return on average total shareholders’ equity is defined as profit attributable to shareholders of the parent company divided by the
average total shareholders’ equity.
Revenue growth provides an important guide
to the Group’s success in generating business.
In 2008, total revenue grew by 3.4 per cent to
US$81.7 billion, 2.1 per cent on an underlying basis,
reflecting the resilience of HSBC’s income
generating capabilities in these exceptionally
difficult economic circumstances.
Revenue mix represents the relative distribution
of revenue streams between net interest income,
net fee income and other revenue. It is used to
understand how changing economic factors affect
the Group, to highlight dependence on balance sheet
utilisation for income generation and to indicate
success in cross-selling fee-based services to
customers with loan facilities. This understanding
assists management in making business investment
decisions. Comparison of the revenue mix between
2005 and 2007 shows a trend of net fee income
increasing at a faster rate than net interest income.
This trend has been reversed in 2008 as net fee
income’s contribution fell by 3.4 percentage points
mainly due to lower fees on cards and equity-related
products.
Cost efficiency is a relative measure that
indicates the consumption of resources in generating
revenue. Management uses this to assess the success
of technology utilisation and, more generally, the
productivity of the Group’s distribution platforms
and sales forces. The cost efficiency ratio for 2008
deteriorated by 10.7 percentage points to 60.1 per
cent. This included writing off goodwill in the US.
Excluding this, the cost efficiency ratio improved by
2.2 percentage points to 47.2 per cent as income
grew faster than costs.
Credit performance as measured by risk-
adjusted margin is an important gauge for assessing
whether credit is correctly priced so that the returns
available after recognising impairment charges meet
the Group’s required return parameters. The ratio
for 2008 was 4.8 per cent, showing a decline of
1.2 percentage points over 2007, as loan impairment