HSBC 2008 Annual Report Download - page 29
Download and view the complete annual report
Please find page 29 of the 2008 HSBC annual report below. You can navigate through the pages in the report by either clicking on the pages listed below, or by using the keyword search tool below to find specific information within the annual report.-
 1
1 -
2
-
3
-
4
-
5
-
6
-
7
-
8
-
9
-
10
-
11
-
12
-
13
-
14
-
15
-
16
-
17
-
18
-
 19
19 -
 20
20 -
 21
21 -
 22
22 -
 23
23 -
 24
24 -
 25
25 -
 26
26 -
 27
27 -
 28
28 -
 29
29 -
 30
30 -
 31
31 -
 32
32 -
 33
33 -
 34
34 -
 35
35 -
 36
36 -
 37
37 -
 38
38 -
 39
39 -
40
-
41
-
42
-
43
-
44
-
45
-
46
-
47
-
48
-
49
-
50
-
51
-
52
-
53
-
54
-
55
-
56
-
57
-
58
-
59
-
60
-
61
-
62
-
63
-
64
-
65
-
66
-
67
-
68
-
69
-
70
-
71
-
72
-
73
-
74
-
75
-
76
-
77
-
78
-
79
-
80
-
81
-
82
-
83
-
84
-
85
-
86
-
87
-
88
-
89
-
90
-
91
-
92
-
93
-
94
-
95
-
96
-
97
-
98
-
99
-
100
-
101
-
102
-
103
-
104
-
105
-
106
-
107
-
108
-
109
-
110
-
111
-
112
-
113
-
114
-
115
-
116
-
117
-
118
-
119
-
120
-
121
-
122
-
123
-
124
-
125
-
126
-
127
-
128
-
129
-
130
-
131
-
132
-
133
-
134
-
135
-
136
-
137
-
138
-
139
-
140
-
141
-
142
-
143
-
144
-
145
-
146
-
147
-
148
-
149
-
150
-
151
-
152
-
153
-
154
-
155
-
156
-
157
-
158
-
159
-
160
-
161
-
162
-
163
-
164
-
165
-
166
-
167
-
168
-
169
-
170
-
171
-
172
-
173
-
174
-
175
-
176
-
177
-
178
-
179
-
180
-
181
-
182
-
183
-
184
-
185
-
186
-
187
-
188
-
189
-
190
-
191
-
192
-
193
-
194
-
195
-
196
-
197
-
198
-
199
-
200
-
201
-
202
-
203
-
204
-
205
-
206
-
207
-
208
-
209
-
210
-
211
-
212
-
213
-
214
-
215
-
216
-
217
-
218
-
219
-
220
-
221
-
222
-
223
-
224
-
225
-
226
-
227
-
228
-
229
-
230
-
231
-
232
-
233
-
234
-
235
-
236
-
237
-
238
-
239
-
240
-
241
-
242
-
243
-
244
-
245
-
246
-
247
-
248
-
249
-
250
-
251
-
252
-
253
-
254
-
255
-
256
-
257
-
258
-
259
-
260
-
261
-
262
-
263
-
264
-
265
-
266
-
267
-
268
-
269
-
270
-
271
-
272
-
273
-
274
-
275
-
276
-
277
-
278
-
279
-
280
-
281
-
282
-
283
-
284
-
285
-
286
-
287
-
288
-
289
-
290
-
291
-
292
-
293
-
294
-
295
-
296
-
297
-
298
-
299
-
300
-
301
-
302
-
303
-
304
-
305
-
306
-
307
-
308
-
309
-
310
-
311
-
312
-
313
-
314
-
315
-
316
-
317
-
318
-
319
-
320
-
321
-
322
-
323
-
324
-
325
-
326
-
327
-
328
-
329
-
330
-
331
-
332
-
333
-
334
-
335
-
336
-
337
-
338
-
339
-
340
-
341
-
342
-
343
-
344
-
345
-
346
-
347
-
348
-
349
-
350
-
351
-
352
-
353
-
354
-
355
-
356
-
357
-
358
-
359
-
360
-
361
-
362
-
363
-
364
-
365
-
366
-
367
-
368
-
369
-
370
-
371
-
372
-
373
-
374
-
375
-
376
-
377
-
378
-
379
-
380
-
381
-
382
-
383
-
384
-
385
-
386
-
387
-
388
-
389
-
390
-
391
-
392
-
393
-
394
-
395
-
396
-
397
-
398
-
399
-
400
-
401
-
402
-
403
-
404
-
405
-
406
-
407
-
408
-
409
-
410
-
411
-
412
-
413
-
414
-
415
-
416
-
417
-
418
-
419
-
420
-
421
-
422
-
423
-
424
-
425
-
426
-
427
-
428
-
429
-
430
-
431
-
432
-
433
-
434
-
435
-
436
-
437
-
438
-
439
-
440
-
441
-
442
-
443
-
444
-
445
-
446
-
447
-
448
-
449
-
450
-
451
-
452
-
453
-
454
-
455
-
456
-
457
-
458
-
459
-
460
-
461
-
462
-
463
-
464
-
465
-
466
-
467
-
468
-
469
-
470
-
471
-
472
 |
 |

27
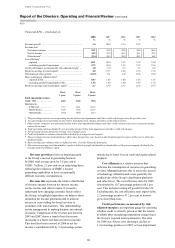
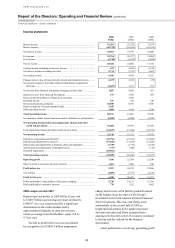
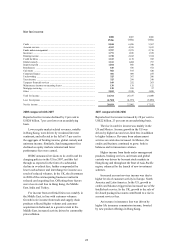
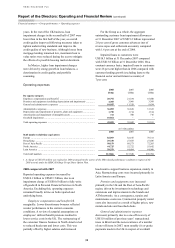
Net fee income
2008
US$m
2007
US$m
2006
US$m
Cards ................................................................................................................ 5,844 6,496 5,367
Account services .............................................................................................. 4,353 4,359 3,633
Funds under management ................................................................................ 2,757 2,975 2,718
Insurance .......................................................................................................... 1,771 1,836 1,358
Broking income ............................................................................................... 1,738 2,012 1,354
Credit facilities ................................................................................................ 1,313 1,138 922
Global custody ................................................................................................. 1,311 1,404 797
Imports/exports ................................................................................................ 1,014 866 780
Remittances ..................................................................................................... 610 556 472
Unit trusts ........................................................................................................ 502 875 520
Corporate finance ............................................................................................ 381 409 255
Underwriting .................................................................................................... 325 367 286
Trust income .................................................................................................... 325 299 248
Taxpayer financial services ............................................................................. 168 252 263
Maintenance income on operating leases ........................................................ 130 139 122
Mortgage servicing .......................................................................................... 120 109 97
Other ................................................................................................................ 2,102 2,245 1,888
Total fee income .............................................................................................. 24,764 26,337 21,080
Less: fee expense ............................................................................................. (4,740) (4,335) (3,898)
Net fee income ................................................................................................. 20,024 22,002 17,182
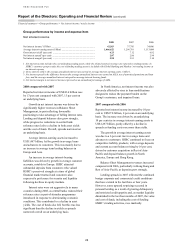
2008 compared with 2007
Reported net fee income declined by 9 per cent to
US$20 billion, 7 per cent lower on an underlying
basis.
Lower equity market-related revenues, notably
in Hong Kong, were driven by weakened investor
sentiment, and reflected in the fall of 17 per cent in
the aggregate of broking income, global custody and
unit trust income. Similarly, fund management fees
declined as equity markets retreated and lower
performance fees were earned.
HSBC announced revisions to its credit card fee
charging policies in the US in 2007, and this fed
through as expected in the form of a substantial
decline in overlimit fees, further compounded by
lower cash advance and interchange fee income as a
result of reduced volumes. In the UK, the divestment
in 2008 of the card acquiring business resulted in
reduced card acquiring fees. Offsetting these factors
were rises in card fees in Hong Kong, the Middle
East, India and Turkey.
Fee income from credit facilities rose, notably in
the Middle East, in line with customer volumes.
Growth in fee income from trade and supply chain
products reflected higher volumes and customer
acquisition in India and, to a greater extent in the
Middle East, increased activity driven by commodity
price inflation.
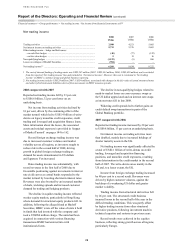
2007 compared with 2006
Reported net fee income increased by 28 per cent to
US$22 billion, 23 per cent on an underlying basis.
The rise in card fee income was mainly in the
US and Mexico. Income growth in the US was
driven by higher late and over-limit fees in addition
to higher balances. Revenue from enhancement
services on cards also increased. In Mexico, the
credit card business continued to grow, both in
balances and in transaction volumes.
Higher income from funds under management
products, broking services, unit trusts and global
custody was driven by buoyant stock markets in
Hong Kong and throughout the Rest of Asia-Pacific
region, enhanced by the launch of new investment
schemes.
Increased account services income was due to
higher levels of customer activity in Europe, North
America and Latin America. In the US, growth in
credit card balances triggered an increased use of the
Intellicheck service. In the UK, growth in the sale of
fee-based packaged accounts contributed to a rise in
account services fees.
An increase in insurance fees was driven by
higher life insurance commission income, boosted
by new product offerings in Hong Kong.