HSBC 2008 Annual Report Download - page 249
Download and view the complete annual report
Please find page 249 of the 2008 HSBC annual report below. You can navigate through the pages in the report by either clicking on the pages listed below, or by using the keyword search tool below to find specific information within the annual report.-
 1
1 -
2
-
3
-
4
-
5
-
6
-
7
-
8
-
9
-
10
-
11
-
12
-
13
-
14
-
15
-
16
-
17
-
18
-
19
-
20
-
21
-
22
-
23
-
24
-
25
-
26
-
27
-
28
-
29
-
30
-
31
-
32
-
33
-
34
-
35
-
36
-
37
-
38
-
39
-
40
-
41
-
42
-
43
-
44
-
45
-
46
-
47
-
48
-
49
-
50
-
51
-
52
-
53
-
54
-
55
-
56
-
57
-
58
-
59
-
60
-
61
-
62
-
63
-
64
-
65
-
66
-
67
-
68
-
69
-
70
-
71
-
72
-
73
-
74
-
75
-
76
-
77
-
78
-
79
-
80
-
81
-
82
-
83
-
84
-
85
-
86
-
87
-
88
-
89
-
90
-
91
-
92
-
93
-
94
-
95
-
96
-
97
-
98
-
99
-
100
-
101
-
102
-
103
-
104
-
105
-
106
-
107
-
108
-
109
-
110
-
111
-
112
-
113
-
114
-
115
-
116
-
117
-
118
-
119
-
120
-
121
-
122
-
123
-
124
-
125
-
126
-
127
-
128
-
129
-
130
-
131
-
132
-
133
-
134
-
135
-
136
-
137
-
138
-
139
-
140
-
141
-
142
-
143
-
144
-
145
-
146
-
147
-
148
-
149
-
150
-
151
-
152
-
153
-
154
-
155
-
156
-
157
-
158
-
159
-
160
-
161
-
162
-
163
-
164
-
165
-
166
-
167
-
168
-
169
-
170
-
171
-
172
-
173
-
174
-
175
-
176
-
177
-
178
-
179
-
180
-
181
-
182
-
183
-
184
-
185
-
186
-
187
-
188
-
189
-
190
-
191
-
192
-
193
-
194
-
195
-
196
-
197
-
198
-
199
-
200
-
201
-
202
-
203
-
204
-
205
-
206
-
207
-
208
-
209
-
210
-
211
-
212
-
213
-
214
-
215
-
216
-
217
-
218
-
219
-
220
-
221
-
222
-
223
-
224
-
225
-
226
-
227
-
228
-
229
-
230
-
231
-
232
-
233
-
234
-
235
-
236
-
237
-
238
-
 239
239 -
 240
240 -
 241
241 -
 242
242 -
 243
243 -
 244
244 -
 245
245 -
 246
246 -
 247
247 -
 248
248 -
 249
249 -
 250
250 -
 251
251 -
 252
252 -
 253
253 -
 254
254 -
 255
255 -
 256
256 -
 257
257 -
 258
258 -
 259
259 -
260
-
261
-
262
-
263
-
264
-
265
-
266
-
267
-
268
-
269
-
270
-
271
-
272
-
273
-
274
-
275
-
276
-
277
-
278
-
279
-
280
-
281
-
282
-
283
-
284
-
285
-
286
-
287
-
288
-
289
-
290
-
291
-
292
-
293
-
294
-
295
-
296
-
297
-
298
-
299
-
300
-
301
-
302
-
303
-
304
-
305
-
306
-
307
-
308
-
309
-
310
-
311
-
312
-
313
-
314
-
315
-
316
-
317
-
318
-
319
-
320
-
321
-
322
-
323
-
324
-
325
-
326
-
327
-
328
-
329
-
330
-
331
-
332
-
333
-
334
-
335
-
336
-
337
-
338
-
339
-
340
-
341
-
342
-
343
-
344
-
345
-
346
-
347
-
348
-
349
-
350
-
351
-
352
-
353
-
354
-
355
-
356
-
357
-
358
-
359
-
360
-
361
-
362
-
363
-
364
-
365
-
366
-
367
-
368
-
369
-
370
-
371
-
372
-
373
-
374
-
375
-
376
-
377
-
378
-
379
-
380
-
381
-
382
-
383
-
384
-
385
-
386
-
387
-
388
-
389
-
390
-
391
-
392
-
393
-
394
-
395
-
396
-
397
-
398
-
399
-
400
-
401
-
402
-
403
-
404
-
405
-
406
-
407
-
408
-
409
-
410
-
411
-
412
-
413
-
414
-
415
-
416
-
417
-
418
-
419
-
420
-
421
-
422
-
423
-
424
-
425
-
426
-
427
-
428
-
429
-
430
-
431
-
432
-
433
-
434
-
435
-
436
-
437
-
438
-
439
-
440
-
441
-
442
-
443
-
444
-
445
-
446
-
447
-
448
-
449
-
450
-
451
-
452
-
453
-
454
-
455
-
456
-
457
-
458
-
459
-
460
-
461
-
462
-
463
-
464
-
465
-
466
-
467
-
468
-
469
-
470
-
471
-
472
 |
 |
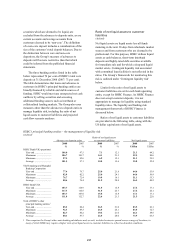
247
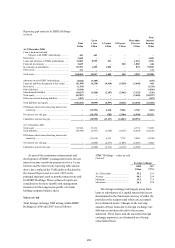
effect of prospective interest rate movements which
could reduce future net interest income, while
balancing the cost of such hedging activities on the
current net revenue stream.
For simulation modelling, businesses use a
combination of scenarios relevant to local businesses
and local markets and standard scenarios which are
required throughout HSBC. The standard scenarios
are consolidated to illustrate the combined pro forma
effect on HSBC’s consolidated portfolio valuations
and net interest income.
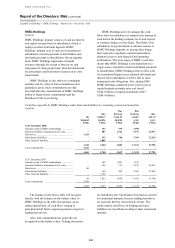
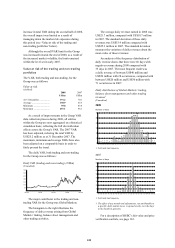
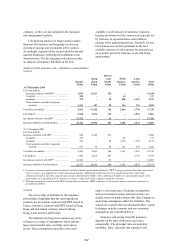
The table below sets out the effect on future net
interest income of an incremental 25 basis points
parallel fall or rise in all yield curves worldwide at
the beginning of each quarter during the 12 months
from 1 January 2009. Assuming no management
actions, a series of such rises would decrease
planned net interest income for 2009 by
US$463 million (2008: US$503 million), while
a series of such falls would decrease planned
net interest income by US$284 million
(2008: increase US$525 million). These figures
incorporate the effect of any option features in the
underlying exposures.
Instead of assuming that all interest rates move
together, HSBC groups its interest rate exposures
into currency blocs whose rates are considered likely
to move together. The sensitivity of projected net
interest income, on this basis, is as follows:
Sensitivity of projected net interest income
(Unaudited)
US dollar
bloc
US$m
Rest of
Americas
bloc
US$m
Hong Kong
dollar
bloc
US$m
Rest of
Asia
bloc
US$m
Sterling
bloc
US$m
Euro
bloc
US$m
Total
US$m
Change in 2009 projected net
interest income arising from
a shift in yield curves of:
+25 basis points at the
beginning of each quarter ..... (243) 42 (45) 100 28 (345) (463)
–25 basis points at the
beginning of each quarter ..... 41 (42) (285) (114) (235) 351 (284)
Change in 2008 projected net
interest income arising from
a shift in yield curves of:
+25 basis points at the
beginning of each quarter ..... (275) 96 9 77 (140) (270) (503)
–25 basis points at the
beginning of each quarter ..... 272 (95) 11 (65) 142 260 525
The interest rate sensitivities set out in the
table above are illustrative only and are based on
simplified scenarios.
The figures represent the effect of the pro forma
movements in net interest income based on the
projected yield curve scenarios and the Group’s
current interest rate risk profile. This effect,
however, does not incorporate actions that would be
taken by Global Markets or in the business units to
mitigate the impact of this interest rate risk. In
reality, Global Markets seeks proactively to change
the interest rate risk profile to minimise losses and
optimise net revenues. The projections above also
assume that interest rates of all maturities move by
the same amount and, therefore, do not reflect the
potential impact on net interest income of some rates
changing while others remain unchanged. The
projections take account of the effect on net interest
income of anticipated differences in changes
between interbank interest rates and interest rates
linked to other bases (such as Central Bank rates or
product rates over which the entity has discretion in
terms of the timing and extent of rate changes). The
projections make other simplifying assumptions too,
including that all positions run to maturity.
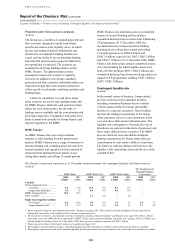
HSBC’s exposure to the effect of movements in
interest rates on its net interest income arises in two
main areas: core deposit franchises and Global
Markets.
• Core deposit franchises: these are exposed to
changes in the cost of deposits raised and
spreads on wholesale funds. In a low interest
rate environment, the net interest income benefit
of core deposits increases as interest rates rise
and decreases as interest rates fall. This risk is
asymmetrical in a very low interest rate
environment, however, as there is limited room