HSBC 2008 Annual Report Download - page 385
Download and view the complete annual report
Please find page 385 of the 2008 HSBC annual report below. You can navigate through the pages in the report by either clicking on the pages listed below, or by using the keyword search tool below to find specific information within the annual report.-
 1
1 -
2
-
3
-
4
-
5
-
6
-
7
-
8
-
9
-
10
-
11
-
12
-
13
-
14
-
15
-
16
-
17
-
18
-
19
-
20
-
21
-
22
-
23
-
24
-
25
-
26
-
27
-
28
-
29
-
30
-
31
-
32
-
33
-
34
-
35
-
36
-
37
-
38
-
39
-
40
-
41
-
42
-
43
-
44
-
45
-
46
-
47
-
48
-
49
-
50
-
51
-
52
-
53
-
54
-
55
-
56
-
57
-
58
-
59
-
60
-
61
-
62
-
63
-
64
-
65
-
66
-
67
-
68
-
69
-
70
-
71
-
72
-
73
-
74
-
75
-
76
-
77
-
78
-
79
-
80
-
81
-
82
-
83
-
84
-
85
-
86
-
87
-
88
-
89
-
90
-
91
-
92
-
93
-
94
-
95
-
96
-
97
-
98
-
99
-
100
-
101
-
102
-
103
-
104
-
105
-
106
-
107
-
108
-
109
-
110
-
111
-
112
-
113
-
114
-
115
-
116
-
117
-
118
-
119
-
120
-
121
-
122
-
123
-
124
-
125
-
126
-
127
-
128
-
129
-
130
-
131
-
132
-
133
-
134
-
135
-
136
-
137
-
138
-
139
-
140
-
141
-
142
-
143
-
144
-
145
-
146
-
147
-
148
-
149
-
150
-
151
-
152
-
153
-
154
-
155
-
156
-
157
-
158
-
159
-
160
-
161
-
162
-
163
-
164
-
165
-
166
-
167
-
168
-
169
-
170
-
171
-
172
-
173
-
174
-
175
-
176
-
177
-
178
-
179
-
180
-
181
-
182
-
183
-
184
-
185
-
186
-
187
-
188
-
189
-
190
-
191
-
192
-
193
-
194
-
195
-
196
-
197
-
198
-
199
-
200
-
201
-
202
-
203
-
204
-
205
-
206
-
207
-
208
-
209
-
210
-
211
-
212
-
213
-
214
-
215
-
216
-
217
-
218
-
219
-
220
-
221
-
222
-
223
-
224
-
225
-
226
-
227
-
228
-
229
-
230
-
231
-
232
-
233
-
234
-
235
-
236
-
237
-
238
-
239
-
240
-
241
-
242
-
243
-
244
-
245
-
246
-
247
-
248
-
249
-
250
-
251
-
252
-
253
-
254
-
255
-
256
-
257
-
258
-
259
-
260
-
261
-
262
-
263
-
264
-
265
-
266
-
267
-
268
-
269
-
270
-
271
-
272
-
273
-
274
-
275
-
276
-
277
-
278
-
279
-
280
-
281
-
282
-
283
-
284
-
285
-
286
-
287
-
288
-
289
-
290
-
291
-
292
-
293
-
294
-
295
-
296
-
297
-
298
-
299
-
300
-
301
-
302
-
303
-
304
-
305
-
306
-
307
-
308
-
309
-
310
-
311
-
312
-
313
-
314
-
315
-
316
-
317
-
318
-
319
-
320
-
321
-
322
-
323
-
324
-
325
-
326
-
327
-
328
-
329
-
330
-
331
-
332
-
333
-
334
-
335
-
336
-
337
-
338
-
339
-
340
-
341
-
342
-
343
-
344
-
345
-
346
-
347
-
348
-
349
-
350
-
351
-
352
-
353
-
354
-
355
-
356
-
357
-
358
-
359
-
360
-
361
-
362
-
363
-
364
-
365
-
366
-
367
-
368
-
369
-
370
-
371
-
372
-
373
-
374
-
 375
375 -
 376
376 -
 377
377 -
 378
378 -
 379
379 -
 380
380 -
 381
381 -
 382
382 -
 383
383 -
 384
384 -
 385
385 -
 386
386 -
 387
387 -
 388
388 -
 389
389 -
 390
390 -
 391
391 -
 392
392 -
 393
393 -
 394
394 -
 395
395 -
396
-
397
-
398
-
399
-
400
-
401
-
402
-
403
-
404
-
405
-
406
-
407
-
408
-
409
-
410
-
411
-
412
-
413
-
414
-
415
-
416
-
417
-
418
-
419
-
420
-
421
-
422
-
423
-
424
-
425
-
426
-
427
-
428
-
429
-
430
-
431
-
432
-
433
-
434
-
435
-
436
-
437
-
438
-
439
-
440
-
441
-
442
-
443
-
444
-
445
-
446
-
447
-
448
-
449
-
450
-
451
-
452
-
453
-
454
-
455
-
456
-
457
-
458
-
459
-
460
-
461
-
462
-
463
-
464
-
465
-
466
-
467
-
468
-
469
-
470
-
471
-
472
 |
 |

383
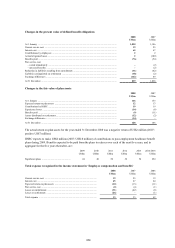
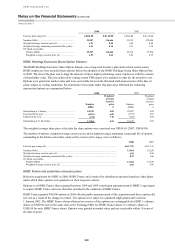
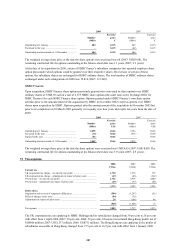
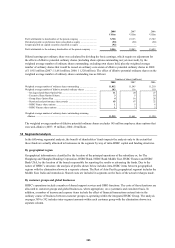
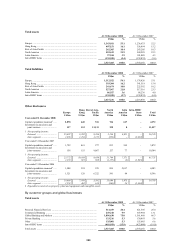
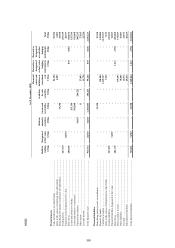
The amount of deferred taxation accounted for in the consolidated balance sheet, before offsetting balances within
countries, comprised the following deferred tax assets and liabilities:
2008 2007
US$m US$m
Deferred tax assets
Retirement benefits ............................................................................................................................ 927 822
Loan impairment allowances ............................................................................................................. 5,891 4,484
Unused tax losses ............................................................................................................................... 282 272
Accelerated capital allowances .......................................................................................................... 99 97
Available-for-sale investments .......................................................................................................... 518 77
Cash flow hedges ............................................................................................................................... 1,145 570
Share-based payments ....................................................................................................................... 245 326
Other short-term temporary differences ............................................................................................ 457 900
9,564 7,548
Deferred tax liabilities
Assets leased to customers ................................................................................................................ 916 1,285
Revaluation of property ..................................................................................................................... 374 507
Accelerated capital allowances .......................................................................................................... 167 206
Other short-term temporary differences ............................................................................................ 419 202
Provision for tax on profit remitted from overseas ........................................................................... 78 102
Available-for-sale investments .......................................................................................................... 121 198
Cash flow hedges ............................................................................................................................... 280 96
Fee income ......................................................................................................................................... 930 943
Other temporary differences .............................................................................................................. 1,123 584
4,408 4,123
Net deferred tax assets before offsetting balances within countries ................................................. 5,156 3,425
After offsetting balances within countries, the balances as disclosed in the consolidated balance sheet are as follows:
2008 2007
US$m US$m
Deferred tax assets ............................................................................................................................. 7,011 5,284
Deferred tax liabilities ....................................................................................................................... (1,855) (1,859)
5,156 3,425
The amount of temporary differences, unused tax losses and unused tax credits for which no deferred tax asset is
recognised in the balance sheet is US$878 million (2007: US$923 million). Of this amount, US$805 million (2007:
US$750 million) has no expiry date and US$73 million (2007: US$173 million) is scheduled to expire within
10 years (2007: 10 years).
Deferred tax is not recognised in respect of the Group’s investments in subsidiaries, branches, associates and interests
in joint ventures where remittance is not contemplated or where no additional tax is expected to arise. The aggregate
amount of temporary differences associated with such investments is US$38,443 million (2007: US$29,947 million;
2006: US$22,424 million).
Of the total net deferred tax assets of US$7.0 billion at 31 December 2008 (2007: US$5.3 billion), US$5.0 billion
(2007: US$3.7 billion) arises in respect of HSBC’s US operations where there has been a recent history of losses. The
recognition of the deferred tax assets in respect of HSBC’s US operations is dependent on the capacity to carry back
up to US$1.9 billion of net operating losses arising in 2009 (2007 capacity: US$7.3 billion) but mainly relies on the
projection of future taxable profits. Management’s forecasts support the assumption that it is probable that the results
of future operations will generate sufficient taxable income to utilise the deferred tax assets. These forecasts rely on
continued liquidity and capital support to the US operations from HSBC, including tax planning strategies
implemented in relation to such support.