HSBC 2008 Annual Report Download - page 84
Download and view the complete annual report
Please find page 84 of the 2008 HSBC annual report below. You can navigate through the pages in the report by either clicking on the pages listed below, or by using the keyword search tool below to find specific information within the annual report.-
 1
1 -
2
-
3
-
4
-
5
-
6
-
7
-
8
-
9
-
10
-
11
-
12
-
13
-
14
-
15
-
16
-
17
-
18
-
19
-
20
-
21
-
22
-
23
-
24
-
25
-
26
-
27
-
28
-
29
-
30
-
31
-
32
-
33
-
34
-
35
-
36
-
37
-
38
-
39
-
40
-
41
-
42
-
43
-
44
-
45
-
46
-
47
-
48
-
49
-
50
-
51
-
52
-
53
-
54
-
55
-
56
-
57
-
58
-
59
-
60
-
61
-
62
-
63
-
64
-
65
-
66
-
67
-
68
-
69
-
70
-
71
-
72
-
73
-
 74
74 -
 75
75 -
 76
76 -
 77
77 -
 78
78 -
 79
79 -
 80
80 -
 81
81 -
 82
82 -
 83
83 -
 84
84 -
 85
85 -
 86
86 -
 87
87 -
 88
88 -
 89
89 -
 90
90 -
 91
91 -
 92
92 -
 93
93 -
 94
94 -
95
-
96
-
97
-
98
-
99
-
100
-
101
-
102
-
103
-
104
-
105
-
106
-
107
-
108
-
109
-
110
-
111
-
112
-
113
-
114
-
115
-
116
-
117
-
118
-
119
-
120
-
121
-
122
-
123
-
124
-
125
-
126
-
127
-
128
-
129
-
130
-
131
-
132
-
133
-
134
-
135
-
136
-
137
-
138
-
139
-
140
-
141
-
142
-
143
-
144
-
145
-
146
-
147
-
148
-
149
-
150
-
151
-
152
-
153
-
154
-
155
-
156
-
157
-
158
-
159
-
160
-
161
-
162
-
163
-
164
-
165
-
166
-
167
-
168
-
169
-
170
-
171
-
172
-
173
-
174
-
175
-
176
-
177
-
178
-
179
-
180
-
181
-
182
-
183
-
184
-
185
-
186
-
187
-
188
-
189
-
190
-
191
-
192
-
193
-
194
-
195
-
196
-
197
-
198
-
199
-
200
-
201
-
202
-
203
-
204
-
205
-
206
-
207
-
208
-
209
-
210
-
211
-
212
-
213
-
214
-
215
-
216
-
217
-
218
-
219
-
220
-
221
-
222
-
223
-
224
-
225
-
226
-
227
-
228
-
229
-
230
-
231
-
232
-
233
-
234
-
235
-
236
-
237
-
238
-
239
-
240
-
241
-
242
-
243
-
244
-
245
-
246
-
247
-
248
-
249
-
250
-
251
-
252
-
253
-
254
-
255
-
256
-
257
-
258
-
259
-
260
-
261
-
262
-
263
-
264
-
265
-
266
-
267
-
268
-
269
-
270
-
271
-
272
-
273
-
274
-
275
-
276
-
277
-
278
-
279
-
280
-
281
-
282
-
283
-
284
-
285
-
286
-
287
-
288
-
289
-
290
-
291
-
292
-
293
-
294
-
295
-
296
-
297
-
298
-
299
-
300
-
301
-
302
-
303
-
304
-
305
-
306
-
307
-
308
-
309
-
310
-
311
-
312
-
313
-
314
-
315
-
316
-
317
-
318
-
319
-
320
-
321
-
322
-
323
-
324
-
325
-
326
-
327
-
328
-
329
-
330
-
331
-
332
-
333
-
334
-
335
-
336
-
337
-
338
-
339
-
340
-
341
-
342
-
343
-
344
-
345
-
346
-
347
-
348
-
349
-
350
-
351
-
352
-
353
-
354
-
355
-
356
-
357
-
358
-
359
-
360
-
361
-
362
-
363
-
364
-
365
-
366
-
367
-
368
-
369
-
370
-
371
-
372
-
373
-
374
-
375
-
376
-
377
-
378
-
379
-
380
-
381
-
382
-
383
-
384
-
385
-
386
-
387
-
388
-
389
-
390
-
391
-
392
-
393
-
394
-
395
-
396
-
397
-
398
-
399
-
400
-
401
-
402
-
403
-
404
-
405
-
406
-
407
-
408
-
409
-
410
-
411
-
412
-
413
-
414
-
415
-
416
-
417
-
418
-
419
-
420
-
421
-
422
-
423
-
424
-
425
-
426
-
427
-
428
-
429
-
430
-
431
-
432
-
433
-
434
-
435
-
436
-
437
-
438
-
439
-
440
-
441
-
442
-
443
-
444
-
445
-
446
-
447
-
448
-
449
-
450
-
451
-
452
-
453
-
454
-
455
-
456
-
457
-
458
-
459
-
460
-
461
-
462
-
463
-
464
-
465
-
466
-
467
-
468
-
469
-
470
-
471
-
472
 |
 |

HSBC HOLDINGS PLC
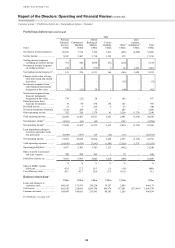
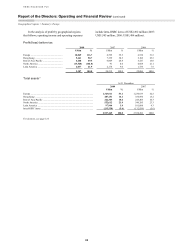
Report of the Directors: Operating and Financial Review (continued)
Customer groups > Other
82
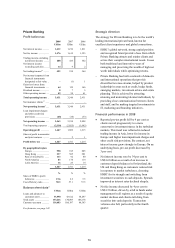
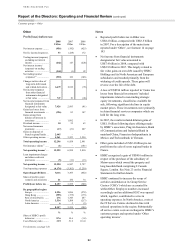
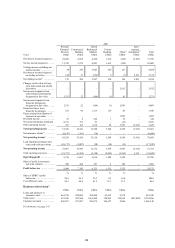
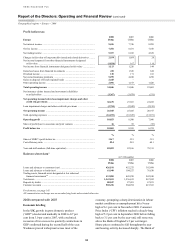
Other
Profit/(loss) before tax
2008 2007 2006
US$m US$m US$m
Net interest expense .......... (956) (542) (625)
Net fee income/(expense) .. 53 (228) 172
Trading income/(expense)
excluding net interest
income ............................ (262) 127 (228)
Net interest income/
(expense) on trading
activities ......................... (268) (1) 82
Net trading income/
(expense)16 .................... (530) 126 (146)
Changes in fair value of
long-term debt issued
and related derivatives .. 6,679 2,812 (35)
Net income/(expense)
from other financial
instruments designated
at fair value ................... 747 81 (46)
Net income/(expense) from
financial instruments
designated at fair value .. 7,426 2,893 (81)
Gains less losses from
financial investments ..... (396) 83 147
Gains arising from
dilution of interests in
associates ....................... – 1,092 –
Dividend income ............... 10 32 63
Net earned insurance
premiums ....................... (17) (21) 207
Gains on disposal of
French regional banks .... 2,445 – –
Other operating income .... 4,261 3,523 3,254
Total operating income .. 12,296 6,958 2,991
Net insurance claims17 ....... (1) – (181)
Net operating income5..... 12,295 6,958 2,810
Loan impairment charges
and other credit risk
provisions ....................... (5) (11) (13)
Net operating income ..... 12,290 6,947 2,797
Total operating expenses .. (4,174) (3,562) (3,259)
Operating profit/(loss) .... 8,116 3,385 (462)
Share of profit in joint
ventures and associates .. 41 150 74
Profit/(loss) before tax .... 8,157 3,535 (388)
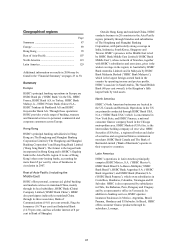
By geographical region
Europe ............................ 5,296 1,056 (278)
Hong Kong ..................... (955) (375) (175)
Rest of Asia-Pacific ....... 276 1,343 287
North America ............... 3,534 1,508 (217)
Latin America ................ 6 3 (5)
8,157 3,535 (388)
% % %
Share of HSBC’s profit
before tax ....................... 87.6
14.6 (1.8)
Cost efficiency ratio .......... 33.9 51.2 116.0
For footnotes, see page 143.
Notes
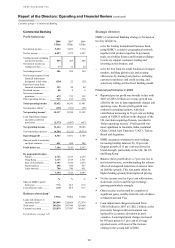
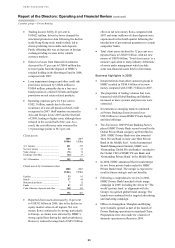
• Reported profit before tax in Other was
US$8.2 billion, compared with US$3.5 billion
in 2007. For a description of the main items
reported under ‘Other’, see footnote 14 on page
143.
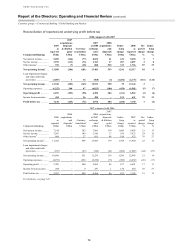
• Net income from financial instruments
designated at fair value amounted to
US$7.4 billion in 2008, compared with
US$2.9 billion in 2007. This largely related to
fair value gains on own debt issued by HSBC
Holdings and its North American and European
subsidiaries and resulted primarily from the
widening of credit spreads. These gains will
reverse over the life of the debt.
• A loss of US$396 million reported in ‘Gains less
losses from financial investments’ included
impairments related to non-trading strategic
equity investments, classified as available for
sale, following significant declines in equity
market prices. These investments were primarily
in Asian financial services companies which are
held for the long term.
• In 2007, the results included dilution gains of
US$1.1 billion following share offerings made
by HSBC’s associates, Ping An Insurance, Bank
of Communications and Industrial Bank in
mainland China, Financiera Independencia in
Mexico and Techcombank in Vietnam.
• Other gains included a US$2.4 billion pre-tax
profit from the sale of seven regional banks in
France.
• HSBC recognised a gain of US$416 million in
respect of the purchase of the subsidiary of
Metrovacesa which owned the property and
long leasehold land comprising 8 Canada
Square, London. See Note 23 on the Financial
Statements for further details.
• HSBC continued to increase the scope of
activities undertaken at its Group Service
Centres (‘GSCs’) which are accounted for
within Other. Employee numbers increased
accordingly and an additional GSC was opened
which, together, contributed to a rise in
operating expenses. In North America, costs at
the IT Service Centres declined in line with
reduced operations in the region. Substantially
all service centre costs are recharged to HSBC’s
customer groups and reported under ‘Other
operating income’.