HSBC 2008 Annual Report Download - page 66
Download and view the complete annual report
Please find page 66 of the 2008 HSBC annual report below. You can navigate through the pages in the report by either clicking on the pages listed below, or by using the keyword search tool below to find specific information within the annual report.-
 1
1 -
2
-
3
-
4
-
5
-
6
-
7
-
8
-
9
-
10
-
11
-
12
-
13
-
14
-
15
-
16
-
17
-
18
-
19
-
20
-
21
-
22
-
23
-
24
-
25
-
26
-
27
-
28
-
29
-
30
-
31
-
32
-
33
-
34
-
35
-
36
-
37
-
38
-
39
-
40
-
41
-
42
-
43
-
44
-
45
-
46
-
47
-
48
-
49
-
50
-
51
-
52
-
53
-
54
-
55
-
 56
56 -
 57
57 -
 58
58 -
 59
59 -
 60
60 -
 61
61 -
 62
62 -
 63
63 -
 64
64 -
 65
65 -
 66
66 -
 67
67 -
 68
68 -
 69
69 -
 70
70 -
 71
71 -
 72
72 -
 73
73 -
 74
74 -
 75
75 -
 76
76 -
77
-
78
-
79
-
80
-
81
-
82
-
83
-
84
-
85
-
86
-
87
-
88
-
89
-
90
-
91
-
92
-
93
-
94
-
95
-
96
-
97
-
98
-
99
-
100
-
101
-
102
-
103
-
104
-
105
-
106
-
107
-
108
-
109
-
110
-
111
-
112
-
113
-
114
-
115
-
116
-
117
-
118
-
119
-
120
-
121
-
122
-
123
-
124
-
125
-
126
-
127
-
128
-
129
-
130
-
131
-
132
-
133
-
134
-
135
-
136
-
137
-
138
-
139
-
140
-
141
-
142
-
143
-
144
-
145
-
146
-
147
-
148
-
149
-
150
-
151
-
152
-
153
-
154
-
155
-
156
-
157
-
158
-
159
-
160
-
161
-
162
-
163
-
164
-
165
-
166
-
167
-
168
-
169
-
170
-
171
-
172
-
173
-
174
-
175
-
176
-
177
-
178
-
179
-
180
-
181
-
182
-
183
-
184
-
185
-
186
-
187
-
188
-
189
-
190
-
191
-
192
-
193
-
194
-
195
-
196
-
197
-
198
-
199
-
200
-
201
-
202
-
203
-
204
-
205
-
206
-
207
-
208
-
209
-
210
-
211
-
212
-
213
-
214
-
215
-
216
-
217
-
218
-
219
-
220
-
221
-
222
-
223
-
224
-
225
-
226
-
227
-
228
-
229
-
230
-
231
-
232
-
233
-
234
-
235
-
236
-
237
-
238
-
239
-
240
-
241
-
242
-
243
-
244
-
245
-
246
-
247
-
248
-
249
-
250
-
251
-
252
-
253
-
254
-
255
-
256
-
257
-
258
-
259
-
260
-
261
-
262
-
263
-
264
-
265
-
266
-
267
-
268
-
269
-
270
-
271
-
272
-
273
-
274
-
275
-
276
-
277
-
278
-
279
-
280
-
281
-
282
-
283
-
284
-
285
-
286
-
287
-
288
-
289
-
290
-
291
-
292
-
293
-
294
-
295
-
296
-
297
-
298
-
299
-
300
-
301
-
302
-
303
-
304
-
305
-
306
-
307
-
308
-
309
-
310
-
311
-
312
-
313
-
314
-
315
-
316
-
317
-
318
-
319
-
320
-
321
-
322
-
323
-
324
-
325
-
326
-
327
-
328
-
329
-
330
-
331
-
332
-
333
-
334
-
335
-
336
-
337
-
338
-
339
-
340
-
341
-
342
-
343
-
344
-
345
-
346
-
347
-
348
-
349
-
350
-
351
-
352
-
353
-
354
-
355
-
356
-
357
-
358
-
359
-
360
-
361
-
362
-
363
-
364
-
365
-
366
-
367
-
368
-
369
-
370
-
371
-
372
-
373
-
374
-
375
-
376
-
377
-
378
-
379
-
380
-
381
-
382
-
383
-
384
-
385
-
386
-
387
-
388
-
389
-
390
-
391
-
392
-
393
-
394
-
395
-
396
-
397
-
398
-
399
-
400
-
401
-
402
-
403
-
404
-
405
-
406
-
407
-
408
-
409
-
410
-
411
-
412
-
413
-
414
-
415
-
416
-
417
-
418
-
419
-
420
-
421
-
422
-
423
-
424
-
425
-
426
-
427
-
428
-
429
-
430
-
431
-
432
-
433
-
434
-
435
-
436
-
437
-
438
-
439
-
440
-
441
-
442
-
443
-
444
-
445
-
446
-
447
-
448
-
449
-
450
-
451
-
452
-
453
-
454
-
455
-
456
-
457
-
458
-
459
-
460
-
461
-
462
-
463
-
464
-
465
-
466
-
467
-
468
-
469
-
470
-
471
-
472
 |
 |

HSBC HOLDINGS PLC
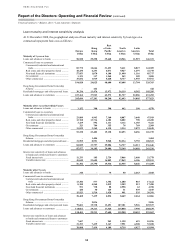
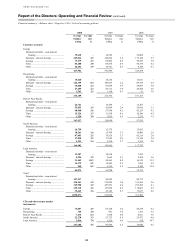
Report of the Directors: Operating and Financial Review (continued)
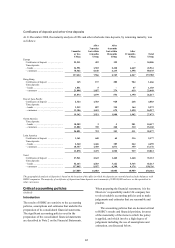
Critical accounting policies
64
The best evidence of fair value is a quoted price
in an actively traded market. In the event that the
market for a financial instrument is not active, a
valuation technique is used. The majority of
valuation techniques employ only observable market
data, and so the reliability of the fair value
measurement is high. However, certain financial
instruments are valued on the basis of valuation
techniques that feature one or more significant
market inputs that are unobservable. Valuation
techniques that rely to a greater extent on
unobservable inputs require a higher level of
management judgement to calculate a fair value than
those based wholly on observable inputs.
Valuation techniques used to calculate fair
values include comparisons with similar financial
instruments for which market observable prices
exist, discounted cash flow analysis, option pricing
models and other valuation techniques commonly
used by market participants. Valuation techniques
incorporate assumptions that other market
participants would use in their valuations, including
assumptions about interest rate yield curves,
exchange rates, volatilities, and prepayment and
default rates. When valuing instruments by reference
to comparable instruments, management takes into
account the maturity, structure and rating of the
instrument with which the position held is being
compared.
The main assumptions and estimates which
management considers when applying a model with
valuation techniques are:
• the likelihood and expected timing of future
cash flows on the instrument. These cash flows
are usually governed by the terms of the
instrument, although management judgement
may be required when the ability of the
counterparty to service the instrument in
accordance with the contractual terms is in
doubt. Future cash flows may be sensitive to
changes in market rates;
• selecting an appropriate discount rate for
the instrument. Management bases the
determination of this rate on its assessment of
what a market participant would regard as the
appropriate spread of the rate for the instrument
over the appropriate risk-free rate; and
• judgement to determine what model to use to
calculate fair value in areas where the choice of
valuation model is particularly subjective, for
example, when valuing complex derivative
products.
When applying a model with unobservable
inputs, estimates are made to reflect uncertainties
in fair values resulting from a lack of market data
inputs, for example, as a result of illiquidity in the
market. For these instruments, the fair value
measurement is less reliable. Inputs into valuations
based on unobservable data are inherently uncertain
because there are little or no current market data
available from which to determine the level at which
an arm’s length transaction would occur under
normal business conditions. However, in most cases
there are some market data available on which to
base a determination of fair value, for example
historical data, and the fair values of most financial
instruments will be based on some market
observable inputs even where the unobservable
inputs are significant.
An analysis of the basis for valuation of
financial instruments measured at fair value in the
financial statements is provided on page 162. The
value of financial assets and liabilities that use a
valuation technique are US$876 billion (2007:
US$626 billion) and US$671 billion (2007: US$401
billion) or 71 per cent (2007: 66 per cent) and 83 per
cent (2007: 68 per cent) of total assets and total
liabilities measured at fair value, respectively. A
sensitivity analysis of fair values for financial
instruments with significant unobservable inputs to
reasonably possible alternative assumptions and a
range of assumptions and inputs used in valuation
models in respect of instruments of particular
interest in the current market turmoil can be found
on page 164. Given the uncertainty and subjective
nature of valuing financial instruments at fair value,
it is possible that the outcomes in the next financial
year could differ from the assumptions used, and this
could result in a material adjustment to the carrying
amount of financial instruments measured at fair
value.
Impairment of available-for-sale financial
assets
HSBC’s accounting policy for impairment of
available-for-sale financial assets is described in
Note 2(j) on the Financial Statements.
Available-for-sale financial assets are measured
at fair value, and changes in fair value are recognised
in equity in the available-for-sale fair value reserve
until the financial assets are either sold or become
impaired. An impairment loss is recognised if there
is objective evidence of impairment as a result of
loss events which have an impact on the estimated
future cash flows of the financial asset that can be
reliably estimated. If an available-for-sale financial
asset becomes impaired, the entire balance in equity