HSBC 2008 Annual Report Download - page 123
Download and view the complete annual report
Please find page 123 of the 2008 HSBC annual report below. You can navigate through the pages in the report by either clicking on the pages listed below, or by using the keyword search tool below to find specific information within the annual report.-
 1
1 -
2
-
3
-
4
-
5
-
6
-
7
-
8
-
9
-
10
-
11
-
12
-
13
-
14
-
15
-
16
-
17
-
18
-
19
-
20
-
21
-
22
-
23
-
24
-
25
-
26
-
27
-
28
-
29
-
30
-
31
-
32
-
33
-
34
-
35
-
36
-
37
-
38
-
39
-
40
-
41
-
42
-
43
-
44
-
45
-
46
-
47
-
48
-
49
-
50
-
51
-
52
-
53
-
54
-
55
-
56
-
57
-
58
-
59
-
60
-
61
-
62
-
63
-
64
-
65
-
66
-
67
-
68
-
69
-
70
-
71
-
72
-
73
-
74
-
75
-
76
-
77
-
78
-
79
-
80
-
81
-
82
-
83
-
84
-
85
-
86
-
87
-
88
-
89
-
90
-
91
-
92
-
93
-
94
-
95
-
96
-
97
-
98
-
99
-
100
-
101
-
102
-
103
-
104
-
105
-
106
-
107
-
108
-
109
-
110
-
111
-
112
-
 113
113 -
 114
114 -
 115
115 -
 116
116 -
 117
117 -
 118
118 -
 119
119 -
 120
120 -
 121
121 -
 122
122 -
 123
123 -
 124
124 -
 125
125 -
 126
126 -
 127
127 -
 128
128 -
 129
129 -
 130
130 -
 131
131 -
 132
132 -
 133
133 -
134
-
135
-
136
-
137
-
138
-
139
-
140
-
141
-
142
-
143
-
144
-
145
-
146
-
147
-
148
-
149
-
150
-
151
-
152
-
153
-
154
-
155
-
156
-
157
-
158
-
159
-
160
-
161
-
162
-
163
-
164
-
165
-
166
-
167
-
168
-
169
-
170
-
171
-
172
-
173
-
174
-
175
-
176
-
177
-
178
-
179
-
180
-
181
-
182
-
183
-
184
-
185
-
186
-
187
-
188
-
189
-
190
-
191
-
192
-
193
-
194
-
195
-
196
-
197
-
198
-
199
-
200
-
201
-
202
-
203
-
204
-
205
-
206
-
207
-
208
-
209
-
210
-
211
-
212
-
213
-
214
-
215
-
216
-
217
-
218
-
219
-
220
-
221
-
222
-
223
-
224
-
225
-
226
-
227
-
228
-
229
-
230
-
231
-
232
-
233
-
234
-
235
-
236
-
237
-
238
-
239
-
240
-
241
-
242
-
243
-
244
-
245
-
246
-
247
-
248
-
249
-
250
-
251
-
252
-
253
-
254
-
255
-
256
-
257
-
258
-
259
-
260
-
261
-
262
-
263
-
264
-
265
-
266
-
267
-
268
-
269
-
270
-
271
-
272
-
273
-
274
-
275
-
276
-
277
-
278
-
279
-
280
-
281
-
282
-
283
-
284
-
285
-
286
-
287
-
288
-
289
-
290
-
291
-
292
-
293
-
294
-
295
-
296
-
297
-
298
-
299
-
300
-
301
-
302
-
303
-
304
-
305
-
306
-
307
-
308
-
309
-
310
-
311
-
312
-
313
-
314
-
315
-
316
-
317
-
318
-
319
-
320
-
321
-
322
-
323
-
324
-
325
-
326
-
327
-
328
-
329
-
330
-
331
-
332
-
333
-
334
-
335
-
336
-
337
-
338
-
339
-
340
-
341
-
342
-
343
-
344
-
345
-
346
-
347
-
348
-
349
-
350
-
351
-
352
-
353
-
354
-
355
-
356
-
357
-
358
-
359
-
360
-
361
-
362
-
363
-
364
-
365
-
366
-
367
-
368
-
369
-
370
-
371
-
372
-
373
-
374
-
375
-
376
-
377
-
378
-
379
-
380
-
381
-
382
-
383
-
384
-
385
-
386
-
387
-
388
-
389
-
390
-
391
-
392
-
393
-
394
-
395
-
396
-
397
-
398
-
399
-
400
-
401
-
402
-
403
-
404
-
405
-
406
-
407
-
408
-
409
-
410
-
411
-
412
-
413
-
414
-
415
-
416
-
417
-
418
-
419
-
420
-
421
-
422
-
423
-
424
-
425
-
426
-
427
-
428
-
429
-
430
-
431
-
432
-
433
-
434
-
435
-
436
-
437
-
438
-
439
-
440
-
441
-
442
-
443
-
444
-
445
-
446
-
447
-
448
-
449
-
450
-
451
-
452
-
453
-
454
-
455
-
456
-
457
-
458
-
459
-
460
-
461
-
462
-
463
-
464
-
465
-
466
-
467
-
468
-
469
-
470
-
471
-
472
 |
 |

121
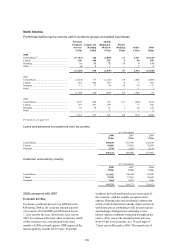
market conditions deteriorated as the unemployment
rate rose from a historical low of 5.8 per cent in
January 2008 to finish the year at 6.6 per cent. After
rising to a level of 3.5 per cent in August 2008, the
headline rate of consumer price inflation slowed to
1.2 per cent by the year-end. The core rate of
inflation remained below 2.0 per cent throughout the
year. Responding to the deteriorating economic
outlook, the Bank of Canada cut its overnight
interest rate from 4.25 per cent at the end of 2007 to
1.5 per cent in December 2008.
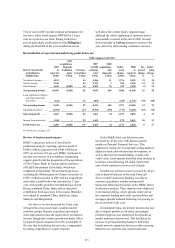
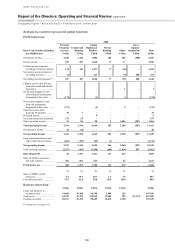
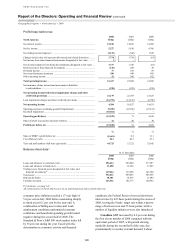
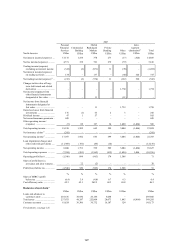
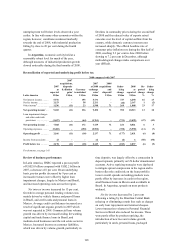
Reconciliation of reported and underlying profit/(loss) before tax
2008 compared with 2007
North America
2007
as
reported
US$m
2007
acquisitions,
disposals
& dilution
gains1
US$m
Currency
translation2
US$m
2007
at 2008
exchange
rates3
US$m
2008
acquisitions
and
disposals1
US$m
Under-
lying
change
US$m
2008
as
reported
US$m
Re-
ported
change
%
Under-
lying
change
%
Net interest income .......... 14,847 1 7 14,855 – 363 15,218 2 2
Net fee income ................. 5,810 (105) 1 5,706 –
(479) 5,227 (10) (8)
Other income4................... 2,126 (18) (1) 2,107 – (1,373) 734 (65) (65)
Net operating income5.... 22,783 (122) 7 22,668 – (1,489) 21,179 (7) (7)
Loan impairment charges
and other credit risk
provisions .................... (12,156) – 12 (12,144) – (4,651) (16,795) (38) (38)
Net operating income .... 10,627 (122) 19 10,524 – (6,140) 4,384 (59) (58)
Operating expenses
(excluding goodwill
impairment) ................. (10,556) 98 (6) (10,464) – 1,105 (9,359) 11 11
Goodwill impairment ....... – – – – – (10,564) (10,564) n/a n/a
Operating profit/(loss).... 71 (24) 13 60 – (15,599) (15,539) (21,986) (25,998)
Income from associates ... 20 – – 20 – (9) 11 (45) (45)
Profit/(loss) before tax ... 91 (24) 13 80 – (15,608) (15,528) (17,164) (19,510)
For footnotes, see page 143.
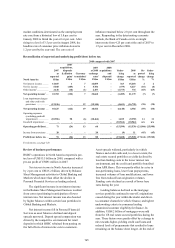
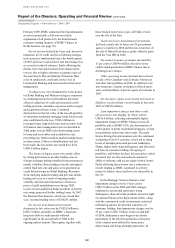
Review of business performance
HSBC’s operations in North America reported a pre-
tax loss of US$15.5 billion in 2008, compared with a
pre-tax profit of US$91 million in 2007.
Net interest income in North America increased
by 2 per cent to US$15.2 billion, driven by Balance
Sheet Management activities in Global Banking and
Markets which more than offset the decline in
Personal Financial Services as lending reduced.
The significant increase in net interest income
in the Balance Sheet Management business resulted
from correct positioning in anticipation of lower
interest rates. Net interest income was also boosted
by higher balances within certain loan portfolios in
Global Banking and Markets.
Net interest income fell in Personal Financial
Services as asset balances declined and deposit
spreads narrowed. Deposit spread compression was
driven by the competitive environment for retail
deposits in which HSBC refrained from passing on
the full effects of interest rate cuts to customers.
Asset spreads widened, particularly in vehicle
finance and credit cards and, to a lesser extent, the
real estate secured portfolios as yields declined by
less than funding costs in the lower interest rate
environment, and the credit card portfolio benefited
from APR floors. This was partly offset by a rise in
non-performing loans, lower loan prepayments,
increased volumes of loan modifications, and lower
fees from reduced loan origination volumes.
Funding costs declined as a result of lower base
rates during the year.
Lending balances declined as the mortgage
services portfolio continued to run-off, originations
ceased during the year within the dealer and direct-
to-consumer channels in vehicle finance, and tighter
underwriting criteria in consumer lending
constrained customer eligibility for finance. In
addition, US$8.2 billion of mortgages were sold
from the US real estate secured portfolios during the
year. These factors were partly offset by a change in
mix towards higher-yielding credit card loans and
reduced levels of prepayments that resulted in loans
remaining on the balance sheet longer. At the end of