HSBC 2008 Annual Report Download - page 23
Download and view the complete annual report
Please find page 23 of the 2008 HSBC annual report below. You can navigate through the pages in the report by either clicking on the pages listed below, or by using the keyword search tool below to find specific information within the annual report.-
 1
1 -
2
-
3
-
4
-
5
-
6
-
7
-
8
-
9
-
10
-
11
-
12
-
 13
13 -
 14
14 -
 15
15 -
 16
16 -
 17
17 -
 18
18 -
 19
19 -
 20
20 -
 21
21 -
 22
22 -
 23
23 -
 24
24 -
 25
25 -
 26
26 -
 27
27 -
 28
28 -
 29
29 -
 30
30 -
 31
31 -
 32
32 -
 33
33 -
34
-
35
-
36
-
37
-
38
-
39
-
40
-
41
-
42
-
43
-
44
-
45
-
46
-
47
-
48
-
49
-
50
-
51
-
52
-
53
-
54
-
55
-
56
-
57
-
58
-
59
-
60
-
61
-
62
-
63
-
64
-
65
-
66
-
67
-
68
-
69
-
70
-
71
-
72
-
73
-
74
-
75
-
76
-
77
-
78
-
79
-
80
-
81
-
82
-
83
-
84
-
85
-
86
-
87
-
88
-
89
-
90
-
91
-
92
-
93
-
94
-
95
-
96
-
97
-
98
-
99
-
100
-
101
-
102
-
103
-
104
-
105
-
106
-
107
-
108
-
109
-
110
-
111
-
112
-
113
-
114
-
115
-
116
-
117
-
118
-
119
-
120
-
121
-
122
-
123
-
124
-
125
-
126
-
127
-
128
-
129
-
130
-
131
-
132
-
133
-
134
-
135
-
136
-
137
-
138
-
139
-
140
-
141
-
142
-
143
-
144
-
145
-
146
-
147
-
148
-
149
-
150
-
151
-
152
-
153
-
154
-
155
-
156
-
157
-
158
-
159
-
160
-
161
-
162
-
163
-
164
-
165
-
166
-
167
-
168
-
169
-
170
-
171
-
172
-
173
-
174
-
175
-
176
-
177
-
178
-
179
-
180
-
181
-
182
-
183
-
184
-
185
-
186
-
187
-
188
-
189
-
190
-
191
-
192
-
193
-
194
-
195
-
196
-
197
-
198
-
199
-
200
-
201
-
202
-
203
-
204
-
205
-
206
-
207
-
208
-
209
-
210
-
211
-
212
-
213
-
214
-
215
-
216
-
217
-
218
-
219
-
220
-
221
-
222
-
223
-
224
-
225
-
226
-
227
-
228
-
229
-
230
-
231
-
232
-
233
-
234
-
235
-
236
-
237
-
238
-
239
-
240
-
241
-
242
-
243
-
244
-
245
-
246
-
247
-
248
-
249
-
250
-
251
-
252
-
253
-
254
-
255
-
256
-
257
-
258
-
259
-
260
-
261
-
262
-
263
-
264
-
265
-
266
-
267
-
268
-
269
-
270
-
271
-
272
-
273
-
274
-
275
-
276
-
277
-
278
-
279
-
280
-
281
-
282
-
283
-
284
-
285
-
286
-
287
-
288
-
289
-
290
-
291
-
292
-
293
-
294
-
295
-
296
-
297
-
298
-
299
-
300
-
301
-
302
-
303
-
304
-
305
-
306
-
307
-
308
-
309
-
310
-
311
-
312
-
313
-
314
-
315
-
316
-
317
-
318
-
319
-
320
-
321
-
322
-
323
-
324
-
325
-
326
-
327
-
328
-
329
-
330
-
331
-
332
-
333
-
334
-
335
-
336
-
337
-
338
-
339
-
340
-
341
-
342
-
343
-
344
-
345
-
346
-
347
-
348
-
349
-
350
-
351
-
352
-
353
-
354
-
355
-
356
-
357
-
358
-
359
-
360
-
361
-
362
-
363
-
364
-
365
-
366
-
367
-
368
-
369
-
370
-
371
-
372
-
373
-
374
-
375
-
376
-
377
-
378
-
379
-
380
-
381
-
382
-
383
-
384
-
385
-
386
-
387
-
388
-
389
-
390
-
391
-
392
-
393
-
394
-
395
-
396
-
397
-
398
-
399
-
400
-
401
-
402
-
403
-
404
-
405
-
406
-
407
-
408
-
409
-
410
-
411
-
412
-
413
-
414
-
415
-
416
-
417
-
418
-
419
-
420
-
421
-
422
-
423
-
424
-
425
-
426
-
427
-
428
-
429
-
430
-
431
-
432
-
433
-
434
-
435
-
436
-
437
-
438
-
439
-
440
-
441
-
442
-
443
-
444
-
445
-
446
-
447
-
448
-
449
-
450
-
451
-
452
-
453
-
454
-
455
-
456
-
457
-
458
-
459
-
460
-
461
-
462
-
463
-
464
-
465
-
466
-
467
-
468
-
469
-
470
-
471
-
472
 |
 |
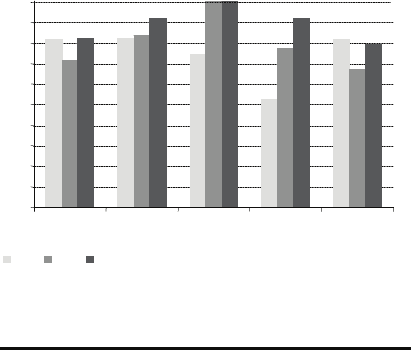
21
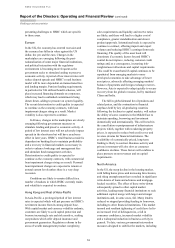
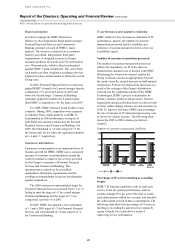
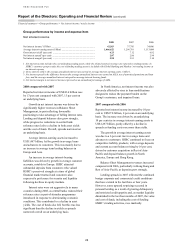
Percentage of IT services meeting or exceeding
targets
90%
91%
92%
93%
94%
95%
96%
97%
98%
99%
100%
Europe HK Rest of
Asia-Pacific
North
America
Latin
America
90%
91%
92%
93%
94%
95%
96%
97%
98%
99%
100%
Europe HK Rest of
Asia-Pacific
North
America
Latin
America
2006 2007 20082006 2007 2008
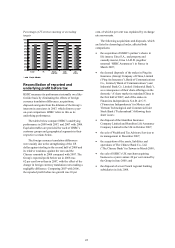
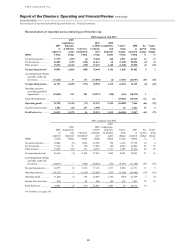
Reconciliation of reported and
underlying profit before tax
HSBC measures its performance internally on a like-
for-like basis by eliminating the effects of foreign
currency translation differences, acquisitions,
disposals and gains from the dilution of the Group’s
interests in associates in 2007, which distort a year-
on-year comparison. HSBC refers to this as its
underlying performance.
The tables below compare HSBC’s underlying
performance in 2008 with 2007, and 2007 with 2006.
Equivalent tables are provided for each of HSBC’s
customer groups and geographical segments in their
respective sections below.
The foreign currency translation differences
were mainly due to the strengthening of the US
dollar against sterling in the second half of 2008 and
its relative weakness against the euro and the
Chinese renminbi in 2008 compared with 2007. The
Group’s reported profit before tax in 2008 was
62 per cent lower than in 2007, with the effect of the
change in foreign currency translation rates making a
negligible difference. Comparing 2007 with 2006,
the reported profit before tax growth was 10 per
cent, of which 4 per cent was explained by exchange
rate movements.
The following acquisitions and disposals, which
are listed in chronological order, affected both
comparisons:
• the acquisition of HSBC’s partner’s shares in
life insurer, Erisa S.A., and property and
casualty insurer, Erisa I.A.R.D. (together
renamed ‘HSBC Assurances’) in France in
March 2007;
• the deemed disposals of the stakes in Ping An
Insurance (Group) Company of China, Limited
(‘Ping An Insurance’), Bank of Communications
Co., Limited (‘Bank of Communications’) and
Industrial Bank Co. Limited (‘Industrial Bank’),
as a consequence of their share offerings on the
domestic ‘A’ share market in mainland China in
the first half of 2007, and of the stakes in
Financiera Independencia S.A.B. de C.V.
(‘Financiera Independencia’) in Mexico and
Vietnam Technological and Commercial Joint
Stock Bank (‘Techcombank’) following their
share issues;
• the disposal of the Hamilton Insurance
Company Limited and Hamilton Life Assurance
Company Limited in the UK in October 2007;
• the sale of Wealth and Tax Advisory Services to
its management in December 2007;
• the acquisition of the assets, liabilities and
operations of The Chinese Bank Co., Ltd.
(‘The Chinese Bank’) in Taiwan in March 2008;
• the sale of HSBC’s UK merchant acquiring
business to a joint venture 49 per cent owned by
the Group in June 2008; and
• the disposal of seven French regional banking
subsidiaries in July 2008.