HSBC 2008 Annual Report Download - page 26
Download and view the complete annual report
Please find page 26 of the 2008 HSBC annual report below. You can navigate through the pages in the report by either clicking on the pages listed below, or by using the keyword search tool below to find specific information within the annual report.-
 1
1 -
2
-
3
-
4
-
5
-
6
-
7
-
8
-
9
-
10
-
11
-
12
-
13
-
14
-
15
-
 16
16 -
 17
17 -
 18
18 -
 19
19 -
 20
20 -
 21
21 -
 22
22 -
 23
23 -
 24
24 -
 25
25 -
 26
26 -
 27
27 -
 28
28 -
 29
29 -
 30
30 -
 31
31 -
 32
32 -
 33
33 -
 34
34 -
 35
35 -
 36
36 -
37
-
38
-
39
-
40
-
41
-
42
-
43
-
44
-
45
-
46
-
47
-
48
-
49
-
50
-
51
-
52
-
53
-
54
-
55
-
56
-
57
-
58
-
59
-
60
-
61
-
62
-
63
-
64
-
65
-
66
-
67
-
68
-
69
-
70
-
71
-
72
-
73
-
74
-
75
-
76
-
77
-
78
-
79
-
80
-
81
-
82
-
83
-
84
-
85
-
86
-
87
-
88
-
89
-
90
-
91
-
92
-
93
-
94
-
95
-
96
-
97
-
98
-
99
-
100
-
101
-
102
-
103
-
104
-
105
-
106
-
107
-
108
-
109
-
110
-
111
-
112
-
113
-
114
-
115
-
116
-
117
-
118
-
119
-
120
-
121
-
122
-
123
-
124
-
125
-
126
-
127
-
128
-
129
-
130
-
131
-
132
-
133
-
134
-
135
-
136
-
137
-
138
-
139
-
140
-
141
-
142
-
143
-
144
-
145
-
146
-
147
-
148
-
149
-
150
-
151
-
152
-
153
-
154
-
155
-
156
-
157
-
158
-
159
-
160
-
161
-
162
-
163
-
164
-
165
-
166
-
167
-
168
-
169
-
170
-
171
-
172
-
173
-
174
-
175
-
176
-
177
-
178
-
179
-
180
-
181
-
182
-
183
-
184
-
185
-
186
-
187
-
188
-
189
-
190
-
191
-
192
-
193
-
194
-
195
-
196
-
197
-
198
-
199
-
200
-
201
-
202
-
203
-
204
-
205
-
206
-
207
-
208
-
209
-
210
-
211
-
212
-
213
-
214
-
215
-
216
-
217
-
218
-
219
-
220
-
221
-
222
-
223
-
224
-
225
-
226
-
227
-
228
-
229
-
230
-
231
-
232
-
233
-
234
-
235
-
236
-
237
-
238
-
239
-
240
-
241
-
242
-
243
-
244
-
245
-
246
-
247
-
248
-
249
-
250
-
251
-
252
-
253
-
254
-
255
-
256
-
257
-
258
-
259
-
260
-
261
-
262
-
263
-
264
-
265
-
266
-
267
-
268
-
269
-
270
-
271
-
272
-
273
-
274
-
275
-
276
-
277
-
278
-
279
-
280
-
281
-
282
-
283
-
284
-
285
-
286
-
287
-
288
-
289
-
290
-
291
-
292
-
293
-
294
-
295
-
296
-
297
-
298
-
299
-
300
-
301
-
302
-
303
-
304
-
305
-
306
-
307
-
308
-
309
-
310
-
311
-
312
-
313
-
314
-
315
-
316
-
317
-
318
-
319
-
320
-
321
-
322
-
323
-
324
-
325
-
326
-
327
-
328
-
329
-
330
-
331
-
332
-
333
-
334
-
335
-
336
-
337
-
338
-
339
-
340
-
341
-
342
-
343
-
344
-
345
-
346
-
347
-
348
-
349
-
350
-
351
-
352
-
353
-
354
-
355
-
356
-
357
-
358
-
359
-
360
-
361
-
362
-
363
-
364
-
365
-
366
-
367
-
368
-
369
-
370
-
371
-
372
-
373
-
374
-
375
-
376
-
377
-
378
-
379
-
380
-
381
-
382
-
383
-
384
-
385
-
386
-
387
-
388
-
389
-
390
-
391
-
392
-
393
-
394
-
395
-
396
-
397
-
398
-
399
-
400
-
401
-
402
-
403
-
404
-
405
-
406
-
407
-
408
-
409
-
410
-
411
-
412
-
413
-
414
-
415
-
416
-
417
-
418
-
419
-
420
-
421
-
422
-
423
-
424
-
425
-
426
-
427
-
428
-
429
-
430
-
431
-
432
-
433
-
434
-
435
-
436
-
437
-
438
-
439
-
440
-
441
-
442
-
443
-
444
-
445
-
446
-
447
-
448
-
449
-
450
-
451
-
452
-
453
-
454
-
455
-
456
-
457
-
458
-
459
-
460
-
461
-
462
-
463
-
464
-
465
-
466
-
467
-
468
-
469
-
470
-
471
-
472
 |
 |

HSBC HOLDINGS PLC
Report of the Directors: Operating and Financial Review (continued)
Financial summary > Income statement
24
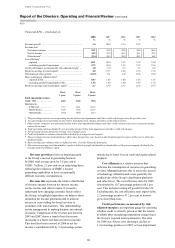
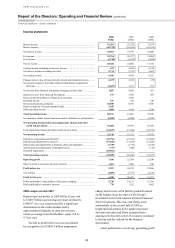
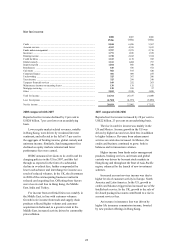
Income statement
2008
US$m
2007
US$m
2006
US$m
Interest income ................................................................................................ 91,301 92,359 75,879
Interest expense ............................................................................................... (48,738) (54,564) (41,393)
Net interest income .......................................................................................... 42,563 37,795 34,486
Fee income ....................................................................................................... 24,764 26,337 21,080
Fee expense ...................................................................................................... (4,740) (4,335) (3,898)
Net fee income ................................................................................................. 20,024 22,002 17,182
Trading income excluding net interest income ............................................... 847 4,458 5,619
Net interest income on trading activities ......................................................... 5,713 5,376 2,603
Net trading income .......................................................................................... 6,560 9,834 8,222
Changes in fair value of long-term debt issued and related derivatives ......... 6,679 2,812 (35)
Net income/(expense) from other financial instruments designated at
fair value ..................................................................................................... (2,827) 1,271 692
Net income from financial instruments designated at fair value .................... 3,852 4,083 657
Gains less losses from financial investments .................................................. 197 1,956 969
Gains arising from dilution of interests in associates ..................................... – 1,092 –
Dividend income .............................................................................................. 272 324 340
Net earned insurance premiums ...................................................................... 10,850 9,076 5,668
Gains on disposal of French regional banks ................................................... 2,445 – –
Other operating income ................................................................................... 1,808 1,439 2,546
Total operating income ................................................................................. 88,571 87,601 70,070
Net insurance claims incurred and movement in liabilities to policyholders . (6,889) (8,608) (4,704)
Net operating income before loan impairment charges and other
credit risk provisions ................................................................................ 81,682 78,993 65,366
Loan impairment charges and other credit risk provisions ............................. (24,937) (17,242) (10,573)
Net operating income .................................................................................... 56,745 61,751 54,793
Employee compensation and benefits ............................................................. (20,792) (21,334) (18,500)
General and administrative expenses .............................................................. (15,260) (15,294) (12,823)
Depreciation and impairment of property, plant and equipment .................... (1,750) (1,714) (1,514)
Amortisation and impairment of intangible assets .......................................... (733) (700) (716)
Goodwill impairment ....................................................................................... (10,564) – –
Total operating expenses ............................................................................... (49,099) (39,042) (33,553)
Operating profit ............................................................................................. 7,646 22,709 21,240
Share of profit in associates and joint ventures ............................................... 1,661 1,503 846
Profit before tax ............................................................................................. 9,307 24,212 22,086
Tax expense ..................................................................................................... (2,809) (3,757) (5,215)
Profit for the year .......................................................................................... 6,498 20,455 16,871
Profit attributable to shareholders of the parent company .............................. 5,728 19,133 15,789
Profit attributable to minority interests ........................................................... 770 1,322 1,082
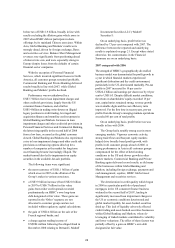
2008 compared with 2007
Reported pre-tax profits in 2008 fell by 62 per cent
to US$9.3 billion and earnings per share declined to
US$0.47. In a year characterised by a significant
deterioration in the credit markets and by
unprecedented illiquidity in most asset classes,
return on average total shareholders’ equity fell to
4.7 per cent.
The fall in profit before tax was exacerbated
by recognition of a US$10.6 billion impairment
charge which wrote off in full the goodwill carried
on the balance sheet in respect of the Group’s
investment in its North America Personal Financial
Services business. This non-cash charge arose
substantially in the second half of 2008 as
heightened risk premia in the market increased
discount rates and cash flows estimated from
ongoing activities fell as the US economy continued
to decline and the outlook for the business
deteriorated.
Asian performance was strong, generating profit