HSBC 2008 Annual Report Download - page 163
Download and view the complete annual report
Please find page 163 of the 2008 HSBC annual report below. You can navigate through the pages in the report by either clicking on the pages listed below, or by using the keyword search tool below to find specific information within the annual report.-
 1
1 -
2
-
3
-
4
-
5
-
6
-
7
-
8
-
9
-
10
-
11
-
12
-
13
-
14
-
15
-
16
-
17
-
18
-
19
-
20
-
21
-
22
-
23
-
24
-
25
-
26
-
27
-
28
-
29
-
30
-
31
-
32
-
33
-
34
-
35
-
36
-
37
-
38
-
39
-
40
-
41
-
42
-
43
-
44
-
45
-
46
-
47
-
48
-
49
-
50
-
51
-
52
-
53
-
54
-
55
-
56
-
57
-
58
-
59
-
60
-
61
-
62
-
63
-
64
-
65
-
66
-
67
-
68
-
69
-
70
-
71
-
72
-
73
-
74
-
75
-
76
-
77
-
78
-
79
-
80
-
81
-
82
-
83
-
84
-
85
-
86
-
87
-
88
-
89
-
90
-
91
-
92
-
93
-
94
-
95
-
96
-
97
-
98
-
99
-
100
-
101
-
102
-
103
-
104
-
105
-
106
-
107
-
108
-
109
-
110
-
111
-
112
-
113
-
114
-
115
-
116
-
117
-
118
-
119
-
120
-
121
-
122
-
123
-
124
-
125
-
126
-
127
-
128
-
129
-
130
-
131
-
132
-
133
-
134
-
135
-
136
-
137
-
138
-
139
-
140
-
141
-
142
-
143
-
144
-
145
-
146
-
147
-
148
-
149
-
150
-
151
-
152
-
 153
153 -
 154
154 -
 155
155 -
 156
156 -
 157
157 -
 158
158 -
 159
159 -
 160
160 -
 161
161 -
 162
162 -
 163
163 -
 164
164 -
 165
165 -
 166
166 -
 167
167 -
 168
168 -
 169
169 -
 170
170 -
 171
171 -
 172
172 -
 173
173 -
174
-
175
-
176
-
177
-
178
-
179
-
180
-
181
-
182
-
183
-
184
-
185
-
186
-
187
-
188
-
189
-
190
-
191
-
192
-
193
-
194
-
195
-
196
-
197
-
198
-
199
-
200
-
201
-
202
-
203
-
204
-
205
-
206
-
207
-
208
-
209
-
210
-
211
-
212
-
213
-
214
-
215
-
216
-
217
-
218
-
219
-
220
-
221
-
222
-
223
-
224
-
225
-
226
-
227
-
228
-
229
-
230
-
231
-
232
-
233
-
234
-
235
-
236
-
237
-
238
-
239
-
240
-
241
-
242
-
243
-
244
-
245
-
246
-
247
-
248
-
249
-
250
-
251
-
252
-
253
-
254
-
255
-
256
-
257
-
258
-
259
-
260
-
261
-
262
-
263
-
264
-
265
-
266
-
267
-
268
-
269
-
270
-
271
-
272
-
273
-
274
-
275
-
276
-
277
-
278
-
279
-
280
-
281
-
282
-
283
-
284
-
285
-
286
-
287
-
288
-
289
-
290
-
291
-
292
-
293
-
294
-
295
-
296
-
297
-
298
-
299
-
300
-
301
-
302
-
303
-
304
-
305
-
306
-
307
-
308
-
309
-
310
-
311
-
312
-
313
-
314
-
315
-
316
-
317
-
318
-
319
-
320
-
321
-
322
-
323
-
324
-
325
-
326
-
327
-
328
-
329
-
330
-
331
-
332
-
333
-
334
-
335
-
336
-
337
-
338
-
339
-
340
-
341
-
342
-
343
-
344
-
345
-
346
-
347
-
348
-
349
-
350
-
351
-
352
-
353
-
354
-
355
-
356
-
357
-
358
-
359
-
360
-
361
-
362
-
363
-
364
-
365
-
366
-
367
-
368
-
369
-
370
-
371
-
372
-
373
-
374
-
375
-
376
-
377
-
378
-
379
-
380
-
381
-
382
-
383
-
384
-
385
-
386
-
387
-
388
-
389
-
390
-
391
-
392
-
393
-
394
-
395
-
396
-
397
-
398
-
399
-
400
-
401
-
402
-
403
-
404
-
405
-
406
-
407
-
408
-
409
-
410
-
411
-
412
-
413
-
414
-
415
-
416
-
417
-
418
-
419
-
420
-
421
-
422
-
423
-
424
-
425
-
426
-
427
-
428
-
429
-
430
-
431
-
432
-
433
-
434
-
435
-
436
-
437
-
438
-
439
-
440
-
441
-
442
-
443
-
444
-
445
-
446
-
447
-
448
-
449
-
450
-
451
-
452
-
453
-
454
-
455
-
456
-
457
-
458
-
459
-
460
-
461
-
462
-
463
-
464
-
465
-
466
-
467
-
468
-
469
-
470
-
471
-
472
 |
 |

161
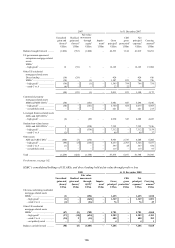
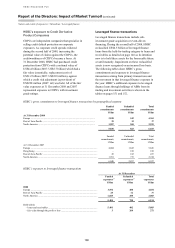
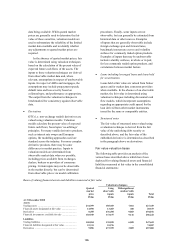
At 31 December
Funded
exposures14
Unfunded
exposures15
Total
exposures
US$m US$m US$m
2007
Europe .................................................................................................................. 3,903 1,813 5,716
Hong Kong .......................................................................................................... – 160 160
Rest of Asia-Pacific ............................................................................................. 45 182 227
North America ..................................................................................................... 1,917 722 2,639
5,865 2,877 8,742
Held within:
– loans and receivables .................................................................................... 424 546 970
– fair value through the profit or loss .............................................................. 5,441 2,331 7,772
For footnotes, see page 162.
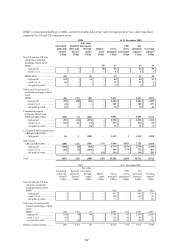
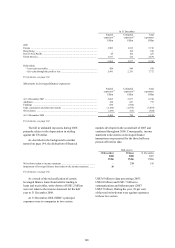
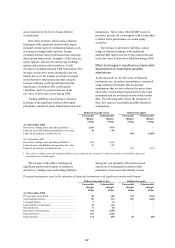
Movement in leveraged finance exposures
Funded
exposures14
Unfunded
exposures15
Total
exposures
US$m US$m US$m
At 31 December 2007 .......................................................................................... 5,865 2,877 8,742
Additions .............................................................................................................. 128 647 775
Fundings .............................................................................................................. 834 (834) –
Sales, repayments and other movements ............................................................ (1,184) (1,875) (3,059)
Write-downs ........................................................................................................ (239) (65) (304)
At 31 December 2008 .......................................................................................... 5,404 750 6,154
For footnotes, see page 162.
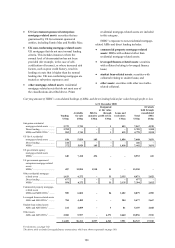
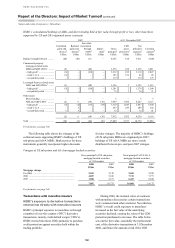
The fall in unfunded exposures during 2008
primarily relates to the depreciation in sterling
against the US dollar.
As described in the background to market
turmoil on page 144, the dislocation of financial
markets developed in the second half of 2007 and
continued throughout 2008. Consequently, income
statement write-downs on leveraged finance
transactions are presented for the three half-year
periods affected to date.
Half-year to
31 December
2008
30 June
2008
31 December
2007
US$m US$m US$m
Write-downs taken to income statement ......................................................... – 278 195
Impairment of leveraged finance loans taken to the income statement .......... 26 – –
For footnotes, see page 162.
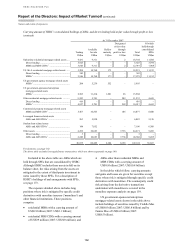
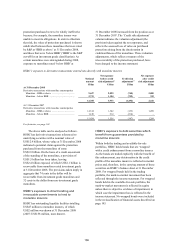
As a result of the reclassification of certain
leveraged finance loans from held-for-trading to
loans and receivables, write-downs of US$1.2 billion
were not taken to the income statement for the half
year to 31 December 2008.
At 31 December 2008, HSBC’s principal
exposures were to companies in two sectors:
US$3.6 billion to data processing (2007:
US$3.8 billion) and US$1.7 billion to
communications and infrastructure (2007:
US$2.7 billion). During the year, 99 per cent
of the total write-downs were against exposures
in these two sectors.