HSBC 2008 Annual Report Download - page 132
Download and view the complete annual report
Please find page 132 of the 2008 HSBC annual report below. You can navigate through the pages in the report by either clicking on the pages listed below, or by using the keyword search tool below to find specific information within the annual report.-
 1
1 -
2
-
3
-
4
-
5
-
6
-
7
-
8
-
9
-
10
-
11
-
12
-
13
-
14
-
15
-
16
-
17
-
18
-
19
-
20
-
21
-
22
-
23
-
24
-
25
-
26
-
27
-
28
-
29
-
30
-
31
-
32
-
33
-
34
-
35
-
36
-
37
-
38
-
39
-
40
-
41
-
42
-
43
-
44
-
45
-
46
-
47
-
48
-
49
-
50
-
51
-
52
-
53
-
54
-
55
-
56
-
57
-
58
-
59
-
60
-
61
-
62
-
63
-
64
-
65
-
66
-
67
-
68
-
69
-
70
-
71
-
72
-
73
-
74
-
75
-
76
-
77
-
78
-
79
-
80
-
81
-
82
-
83
-
84
-
85
-
86
-
87
-
88
-
89
-
90
-
91
-
92
-
93
-
94
-
95
-
96
-
97
-
98
-
99
-
100
-
101
-
102
-
103
-
104
-
105
-
106
-
107
-
108
-
109
-
110
-
111
-
112
-
113
-
114
-
115
-
116
-
117
-
118
-
119
-
120
-
121
-
 122
122 -
 123
123 -
 124
124 -
 125
125 -
 126
126 -
 127
127 -
 128
128 -
 129
129 -
 130
130 -
 131
131 -
 132
132 -
 133
133 -
 134
134 -
 135
135 -
 136
136 -
 137
137 -
 138
138 -
 139
139 -
 140
140 -
 141
141 -
 142
142 -
143
-
144
-
145
-
146
-
147
-
148
-
149
-
150
-
151
-
152
-
153
-
154
-
155
-
156
-
157
-
158
-
159
-
160
-
161
-
162
-
163
-
164
-
165
-
166
-
167
-
168
-
169
-
170
-
171
-
172
-
173
-
174
-
175
-
176
-
177
-
178
-
179
-
180
-
181
-
182
-
183
-
184
-
185
-
186
-
187
-
188
-
189
-
190
-
191
-
192
-
193
-
194
-
195
-
196
-
197
-
198
-
199
-
200
-
201
-
202
-
203
-
204
-
205
-
206
-
207
-
208
-
209
-
210
-
211
-
212
-
213
-
214
-
215
-
216
-
217
-
218
-
219
-
220
-
221
-
222
-
223
-
224
-
225
-
226
-
227
-
228
-
229
-
230
-
231
-
232
-
233
-
234
-
235
-
236
-
237
-
238
-
239
-
240
-
241
-
242
-
243
-
244
-
245
-
246
-
247
-
248
-
249
-
250
-
251
-
252
-
253
-
254
-
255
-
256
-
257
-
258
-
259
-
260
-
261
-
262
-
263
-
264
-
265
-
266
-
267
-
268
-
269
-
270
-
271
-
272
-
273
-
274
-
275
-
276
-
277
-
278
-
279
-
280
-
281
-
282
-
283
-
284
-
285
-
286
-
287
-
288
-
289
-
290
-
291
-
292
-
293
-
294
-
295
-
296
-
297
-
298
-
299
-
300
-
301
-
302
-
303
-
304
-
305
-
306
-
307
-
308
-
309
-
310
-
311
-
312
-
313
-
314
-
315
-
316
-
317
-
318
-
319
-
320
-
321
-
322
-
323
-
324
-
325
-
326
-
327
-
328
-
329
-
330
-
331
-
332
-
333
-
334
-
335
-
336
-
337
-
338
-
339
-
340
-
341
-
342
-
343
-
344
-
345
-
346
-
347
-
348
-
349
-
350
-
351
-
352
-
353
-
354
-
355
-
356
-
357
-
358
-
359
-
360
-
361
-
362
-
363
-
364
-
365
-
366
-
367
-
368
-
369
-
370
-
371
-
372
-
373
-
374
-
375
-
376
-
377
-
378
-
379
-
380
-
381
-
382
-
383
-
384
-
385
-
386
-
387
-
388
-
389
-
390
-
391
-
392
-
393
-
394
-
395
-
396
-
397
-
398
-
399
-
400
-
401
-
402
-
403
-
404
-
405
-
406
-
407
-
408
-
409
-
410
-
411
-
412
-
413
-
414
-
415
-
416
-
417
-
418
-
419
-
420
-
421
-
422
-
423
-
424
-
425
-
426
-
427
-
428
-
429
-
430
-
431
-
432
-
433
-
434
-
435
-
436
-
437
-
438
-
439
-
440
-
441
-
442
-
443
-
444
-
445
-
446
-
447
-
448
-
449
-
450
-
451
-
452
-
453
-
454
-
455
-
456
-
457
-
458
-
459
-
460
-
461
-
462
-
463
-
464
-
465
-
466
-
467
-
468
-
469
-
470
-
471
-
472
 |
 |

HSBC HOLDINGS PLC
Report of the Directors: Operating and Financial Review (continued)
Geographical regions > Latin America > 2008
130
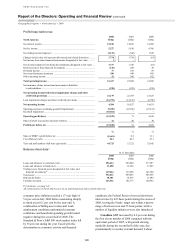
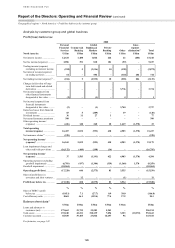
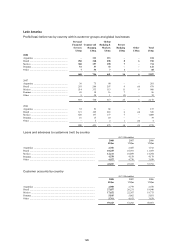
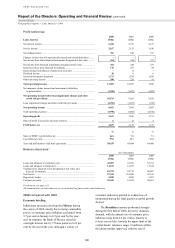
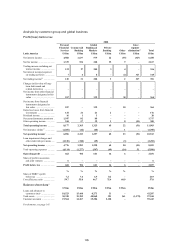
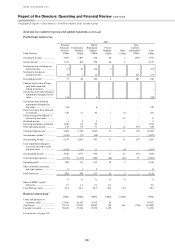
Profit before tax
2008 2007 2006
Latin America US$m US$m US$m
Net interest income .......................................................................................... 6,458 5,576 4,197
Net fee income ................................................................................................. 2,167 2,153 1,630
Net trading income .......................................................................................... 701 548 537
Changes in fair value of long-term debt issued and related derivatives ......... –– –
Net income from other financial instruments designated at fair value ........... 364 320 237
Net income from financial instruments designated at fair value .................... 364 320 237
Gains less losses from financial investments .................................................. 176 253 84
Gains arising from dilution of interests in associates ...................................... – 11 –
Dividend income .............................................................................................. 20 9 6
Net earned insurance premiums ...................................................................... 1,717 1,594 1,076
Other operating income ................................................................................... 300 228 91
Total operating income ................................................................................. 11,903 10,692 7,858
Net insurance claims incurred and movement in liabilities
to policyholders .......................................................................................... (1,390) (1,427) (1,023)
Net operating income before loan impairment charges and other
credit risk provisions ................................................................................ 10,513 9,265 6,835
Loan impairment charges and other credit risk provisions ............................. (2,492) (1,697) (938)
Net operating income .................................................................................... 8,021 7,568 5,897
Total operating expenses ................................................................................. (5,990) (5,402) (4,166)
Operating profit ............................................................................................. 2,031 2,166 1,731
Share of profit in associates and joint ventures ............................................... 6 12 4
Profit before tax ............................................................................................. 2,037 2,178 1,735
%
%
%
Share of HSBC’s profit before tax .................................................................. 21.9
9.0
7.9
Cost efficiency ratio ........................................................................................ 57.0
58.3
61.0
Year-end staff numbers (full-time equivalent) ................................................ 58,559 64,404 64,900
Balance sheet data15
At 31 December
2008 2007 2006
US$m US$m US$m
Loans and advances to customers (net) ........................................................... 42,287 47,923 35,791
Loans and advances to banks (net) .................................................................. 14,572 12,675 12,634
Trading assets, financial assets designated at fair value, and
financial investments ................................................................................... 18,753 24,715 20,497
Total assets ...................................................................................................... 97,944 101,088 82,169
Deposits by banks ............................................................................................ 5,598 4,092 5,267
Customer accounts ........................................................................................... 59,443 61,292 50,861
For footnote, see page 143.
All commentaries on Latin America are on an underlying basis unless stated otherwise.
2008 compared with 2007
Economic briefing
Inflationary pressures developed in Mexico during
the course of 2008, mostly due to rising commodity
prices, as consumer price inflation accelerated from
3.7 per cent in January to 6.5 per cent by the year-
end. In response, the Bank of Mexico raised its
overnight interest rate by 75 basis points to 8.25 per
cent by the end of the year, although a variety of
economic indicators pointed to a sharp loss of
momentum during the final quarter as global growth
slowed.
The Brazilian economy performed strongly
during the first half of 2008, driven by domestic
demand, with the annual rate of consumer price
inflation rising from 4.6 per cent in January to
6.4 per cent in July, towards the upper limit of the
central banks’ tolerance range. Conditions within
the labour market improved, with the rate of