HSBC 2008 Annual Report Download - page 240
Download and view the complete annual report
Please find page 240 of the 2008 HSBC annual report below. You can navigate through the pages in the report by either clicking on the pages listed below, or by using the keyword search tool below to find specific information within the annual report.-
 1
1 -
2
-
3
-
4
-
5
-
6
-
7
-
8
-
9
-
10
-
11
-
12
-
13
-
14
-
15
-
16
-
17
-
18
-
19
-
20
-
21
-
22
-
23
-
24
-
25
-
26
-
27
-
28
-
29
-
30
-
31
-
32
-
33
-
34
-
35
-
36
-
37
-
38
-
39
-
40
-
41
-
42
-
43
-
44
-
45
-
46
-
47
-
48
-
49
-
50
-
51
-
52
-
53
-
54
-
55
-
56
-
57
-
58
-
59
-
60
-
61
-
62
-
63
-
64
-
65
-
66
-
67
-
68
-
69
-
70
-
71
-
72
-
73
-
74
-
75
-
76
-
77
-
78
-
79
-
80
-
81
-
82
-
83
-
84
-
85
-
86
-
87
-
88
-
89
-
90
-
91
-
92
-
93
-
94
-
95
-
96
-
97
-
98
-
99
-
100
-
101
-
102
-
103
-
104
-
105
-
106
-
107
-
108
-
109
-
110
-
111
-
112
-
113
-
114
-
115
-
116
-
117
-
118
-
119
-
120
-
121
-
122
-
123
-
124
-
125
-
126
-
127
-
128
-
129
-
130
-
131
-
132
-
133
-
134
-
135
-
136
-
137
-
138
-
139
-
140
-
141
-
142
-
143
-
144
-
145
-
146
-
147
-
148
-
149
-
150
-
151
-
152
-
153
-
154
-
155
-
156
-
157
-
158
-
159
-
160
-
161
-
162
-
163
-
164
-
165
-
166
-
167
-
168
-
169
-
170
-
171
-
172
-
173
-
174
-
175
-
176
-
177
-
178
-
179
-
180
-
181
-
182
-
183
-
184
-
185
-
186
-
187
-
188
-
189
-
190
-
191
-
192
-
193
-
194
-
195
-
196
-
197
-
198
-
199
-
200
-
201
-
202
-
203
-
204
-
205
-
206
-
207
-
208
-
209
-
210
-
211
-
212
-
213
-
214
-
215
-
216
-
217
-
218
-
219
-
220
-
221
-
222
-
223
-
224
-
225
-
226
-
227
-
228
-
229
-
 230
230 -
 231
231 -
 232
232 -
 233
233 -
 234
234 -
 235
235 -
 236
236 -
 237
237 -
 238
238 -
 239
239 -
 240
240 -
 241
241 -
 242
242 -
 243
243 -
 244
244 -
 245
245 -
 246
246 -
 247
247 -
 248
248 -
 249
249 -
 250
250 -
251
-
252
-
253
-
254
-
255
-
256
-
257
-
258
-
259
-
260
-
261
-
262
-
263
-
264
-
265
-
266
-
267
-
268
-
269
-
270
-
271
-
272
-
273
-
274
-
275
-
276
-
277
-
278
-
279
-
280
-
281
-
282
-
283
-
284
-
285
-
286
-
287
-
288
-
289
-
290
-
291
-
292
-
293
-
294
-
295
-
296
-
297
-
298
-
299
-
300
-
301
-
302
-
303
-
304
-
305
-
306
-
307
-
308
-
309
-
310
-
311
-
312
-
313
-
314
-
315
-
316
-
317
-
318
-
319
-
320
-
321
-
322
-
323
-
324
-
325
-
326
-
327
-
328
-
329
-
330
-
331
-
332
-
333
-
334
-
335
-
336
-
337
-
338
-
339
-
340
-
341
-
342
-
343
-
344
-
345
-
346
-
347
-
348
-
349
-
350
-
351
-
352
-
353
-
354
-
355
-
356
-
357
-
358
-
359
-
360
-
361
-
362
-
363
-
364
-
365
-
366
-
367
-
368
-
369
-
370
-
371
-
372
-
373
-
374
-
375
-
376
-
377
-
378
-
379
-
380
-
381
-
382
-
383
-
384
-
385
-
386
-
387
-
388
-
389
-
390
-
391
-
392
-
393
-
394
-
395
-
396
-
397
-
398
-
399
-
400
-
401
-
402
-
403
-
404
-
405
-
406
-
407
-
408
-
409
-
410
-
411
-
412
-
413
-
414
-
415
-
416
-
417
-
418
-
419
-
420
-
421
-
422
-
423
-
424
-
425
-
426
-
427
-
428
-
429
-
430
-
431
-
432
-
433
-
434
-
435
-
436
-
437
-
438
-
439
-
440
-
441
-
442
-
443
-
444
-
445
-
446
-
447
-
448
-
449
-
450
-
451
-
452
-
453
-
454
-
455
-
456
-
457
-
458
-
459
-
460
-
461
-
462
-
463
-
464
-
465
-
466
-
467
-
468
-
469
-
470
-
471
-
472
 |
 |

HSBC HOLDINGS PLC
Report of the Directors: Risk (continued)
Liquidity and funding > Primary sources of funding / Contingent liquidity risk / Impact of market turmoil
238
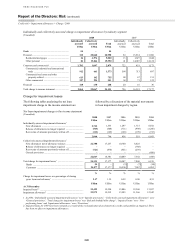
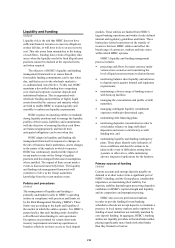
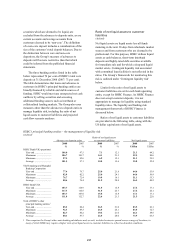
Projected cash flow scenario analysis
(Audited)
The Group uses a number of standard projected cash
flow scenarios designed to model both Group-
specific and market-wide liquidity crises, in which
the rate and timing of deposit withdrawals and
drawdowns on committed lending facilities are
varied, and the ability to access interbank funding
and term debt markets and to generate funds from
asset portfolios is restricted. The scenarios are
modelled by all Group banking entities and by
HSBC Finance. The appropriateness of the
assumptions under each scenario is regularly
reviewed. In addition to the Group’s standard
projected cash flow scenarios, individual entities are
required to design their own scenarios tailored to
reflect specific local market conditions, products and
funding bases.
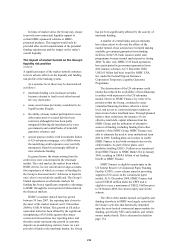
Limits for cumulative net cash flows under
stress scenarios are set for each banking entity and
for HSBC Finance. Both ratio and cash flow limits
reflect the local market place, the diversity of
funding sources available and the concentration risk
from large depositors. Compliance with entity level
limits is monitored centrally by Group Finance and
reported regularly to the RMM.
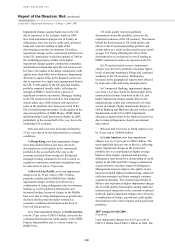
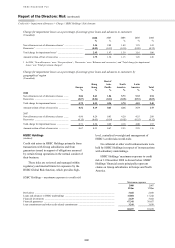
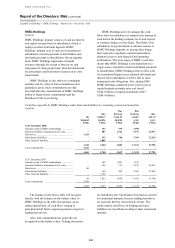
HSBC Finance
As HSBC Finance does not accept customer
deposits, it takes funding from the professional
markets. HSBC Finance uses a range of measures to
monitor funding risk, including projected cash flow
scenario analysis and caps placed on the amount of
unsecured term funding that can mature in any
rolling three-month and rolling 12-month periods.
HSBC Finance also maintains access to committed
sources of secured funding and has in place
committed backstop lines for short-term refinancing
CP programmes. At 31 December 2008, the
maximum amounts of unsecured term funding
maturing in any rolling three-month and rolling
12-month periods were US$6.0 billion and
US$17.4 billion, respectively (2007: US$6.2 billion
and US$17.7 billion). At 31 December 2008, HSBC
Finance also had in place unused committed sources
of secured funding for which eligible assets were
held, of US$2.4 billion (2007: US$6.2 billion) and
committed backstop lines from non-Group entities in
support of CP programmes totalling US$7.3 billion
(2007: US$9.3 billion).
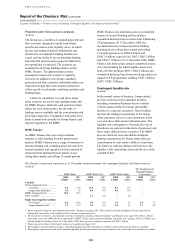
Contingent liquidity risk
(Audited)
In the normal course of business, Group entities
provide customers with committed facilities,
including committed backstop lines to conduit
vehicles sponsored by the Group and standby
facilities to corporate customers. These facilities
increase the funding requirements of the Group
when customers choose to raise drawdown levels
over and above their normal utilisation rates. The
liquidity risk consequences of increased levels of
drawdown are analysed in the form of projected cash
flows under different stress scenarios. The RMM
also sets limits for non-cancellable contingent
funding commitments by Group entity after due
consideration of each entity’s ability to fund them.
The limits are split according to the borrower, the
liquidity of the underlying assets and the size of the
committed line.
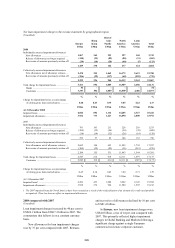
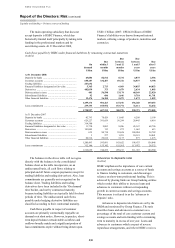
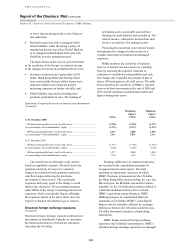
The Group’s contractual exposures at 31 December monitored under the contingent liquidity risk limit structure
(Audited)
HSBC Bank HSBC Bank USA HSBC Bank Canada
The Hongkong and
Shanghai Banking
Corporation
2008 2007 2008 2007 2008 2007 2008 2007
US$bn US$bn US$bn US$bn US$bn US$bn US$bn US$bn
Conduits
Client-originated assets1 .............
– total lines ............................. 5.6 11.0 11.2 9.5 0.3 0.7 – –
– largest individual lines ........ 1.0 1.6 0.4 0.9 0.2 0.4 – –
HSBC-managed assets2 .............. 34.8 25.7 – – – – – –
Other conduits3 ........................... – – 1.1 2.6 – 1.8 – –
Single-issuer liquidity facilities
– five largest4 .......................... 6.0 10.0 5.0 5.9 1.5 1.1 1.0 1.3
– largest market sector5 .......... 7.3 11.7 3.5 4.2 2.4 1.5 1.7 2.3
1 These exposures relate to consolidated multi-seller conduits (see page 184). These vehicles provide funding to Group customers by
issuing debt secured by a diversified pool of customer-originated assets.
2 These exposures relate to consolidated securities investment conduits, primarily Solitaire and Mazarin (see page 184). These vehicles
issue debt secured by ABSs which are managed by HSBC. Of the total contingent liquidity risk under this category, US$25.3 billion was
already funded on-balance sheet at 31 December 2008 leaving a net contingent exposure of US$9.5 billion.
3 These exposures relate to third-party sponsored conduits (see page 187).
4 These figures represent the five largest committed liquidity facilities provided to customers other than those facilities to conduits.
5 These figures represent the total of all committed liquidity facilities provided to the largest market sector, other than those facilities to conduits.