Xerox 2012 Annual Report Download - page 98
Download and view the complete annual report
Please find page 98 of the 2012 Xerox annual report below. You can navigate through the pages in the report by either clicking on the pages listed below, or by using the keyword search tool below to find specific information within the annual report.-
 1
1 -
2
-
3
-
4
-
5
-
6
-
7
-
8
-
9
-
10
-
11
-
12
-
13
-
14
-
15
-
16
-
17
-
18
-
19
-
20
-
21
-
22
-
23
-
24
-
25
-
26
-
27
-
28
-
29
-
30
-
31
-
32
-
33
-
34
-
35
-
36
-
37
-
38
-
39
-
40
-
41
-
42
-
43
-
44
-
45
-
46
-
47
-
48
-
49
-
50
-
51
-
52
-
53
-
54
-
55
-
56
-
57
-
58
-
59
-
60
-
61
-
62
-
63
-
64
-
65
-
66
-
67
-
68
-
69
-
70
-
71
-
72
-
73
-
74
-
75
-
76
-
77
-
78
-
79
-
80
-
81
-
82
-
83
-
84
-
85
-
86
-
87
-
 88
88 -
 89
89 -
 90
90 -
 91
91 -
 92
92 -
 93
93 -
 94
94 -
 95
95 -
 96
96 -
 97
97 -
 98
98 -
 99
99 -
 100
100 -
 101
101 -
 102
102 -
 103
103 -
 104
104 -
 105
105 -
 106
106 -
 107
107 -
 108
108 -
109
-
110
-
111
-
112
-
113
-
114
-
115
-
116
-
117
-
118
-
119
-
120
 |
 |

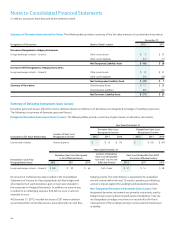
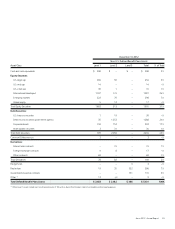
Notes to Consolidated Financial Statements
(in millions, except per-share data and where otherwise noted)
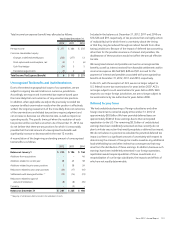
96
December 31, 2011
U.S. Defined Benefit Plans Assets
Asset Class Level 1 Level 2 Level 3 Total % of Total
Cash and cash equivalents $ 198 $ – $ – $ 198 6%
Equity Securities:
U.S. large cap 366 7 – 373 11%
Xerox common stock 50 – – 50 2%
U.S. mid cap 69 – – 69 2%
U.S. small cap 56 89 – 145 4%
International developed 162 327 – 489 15%
Emerging markets 117 – – 117 3%
Total Equity Securities 820 423 – 1,243 37%
Debt Securities:
U.S. treasury securities 4 393 – 397 12%
Debt security issued by government agency – 180 – 180 5%
Corporate bonds 6 875 – 881 26%
Asset backed securities – 10 – 10 –
Total Debt Securities 10 1,458 – 1,468 43%
Derivatives:
Interest rate contracts 18 13 – 31 1%
Foreign exchange contracts 8 – – 8 –
Equity contracts 23 – – 23 1%
Total Derivatives 49 13 – 62 2%
Real estate 45 35 72 152 5%
Private equity/Venture capital – – 318 318 9%
Other (1) (62) 14 – (48) (2)%
Total Defined Benefit Plans Assets $ 1,060 $ 1,943 $ 390 $ 3,393 100%
(1) Other Level 1 assets include net non-financial liabilities of $62 such as due to/from broker, interest receivables and accrued expenses.