Xerox 2012 Annual Report Download - page 13
Download and view the complete annual report
Please find page 13 of the 2012 Xerox annual report below. You can navigate through the pages in the report by either clicking on the pages listed below, or by using the keyword search tool below to find specific information within the annual report.-
 1
1 -
2
-
 3
3 -
 4
4 -
 5
5 -
 6
6 -
 7
7 -
 8
8 -
 9
9 -
 10
10 -
 11
11 -
 12
12 -
 13
13 -
 14
14 -
 15
15 -
 16
16 -
 17
17 -
 18
18 -
 19
19 -
 20
20 -
 21
21 -
 22
22 -
 23
23 -
24
-
25
-
26
-
27
-
28
-
29
-
30
-
31
-
32
-
33
-
34
-
35
-
36
-
37
-
38
-
39
-
40
-
41
-
42
-
43
-
44
-
45
-
46
-
47
-
48
-
49
-
50
-
51
-
52
-
53
-
54
-
55
-
56
-
57
-
58
-
59
-
60
-
61
-
62
-
63
-
64
-
65
-
66
-
67
-
68
-
69
-
70
-
71
-
72
-
73
-
74
-
75
-
76
-
77
-
78
-
79
-
80
-
81
-
82
-
83
-
84
-
85
-
86
-
87
-
88
-
89
-
90
-
91
-
92
-
93
-
94
-
95
-
96
-
97
-
98
-
99
-
100
-
101
-
102
-
103
-
104
-
105
-
106
-
107
-
108
-
109
-
110
-
111
-
112
-
113
-
114
-
115
-
116
-
117
-
118
-
119
-
120
 |
 |
11Xerox 2012 Annual Report
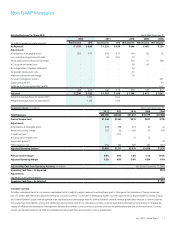
Non-GAAP Measures
Constant Currency
To better understand trends in our business, we believe that it is helpful to adjust revenue to exclude the impact of changes in the translation of foreign currencies
into U.S. dollars. We refer to this adjusted revenue as “constant currency.” Currencies for developing market countries (Latin America, Brazil, Middle East, India, Eurasia
and Central-Eastern Europe) that we operate in are reported at actual exchange rates for both actual and constant revenue growth rates because (1) these countries
historically have had volatile currency and inflationary environments and (2) our subsidiaries in these countries have historically taken pricing actions to mitigate the
impact of inflation and devaluation. Management believes the constant currency measure provides investors an additional perspective on revenue trends. Currency
impact can be determined as the difference between actual growth rates and constant currency growth rates.
Adjusted Earnings Per Share (EPS) Year Ended December 31,
(in millions; except per-share amounts)
2012 2011 2010 2009 2008
Net Income EPS Net Income EPS Net Income Net Income Net Income
As Reported $ 1,195 $ 0.88 $ 1,295 $ 0.90 $ 606 $ 485 $ 230
Adjustments:
Amortization of intangible assets 203 0.15 248 0.17 194 38 35
Loss on early extinguishment of debt - - 20 0.01 10 - -
Xerox and Fuji Xerox restructuring charge - - - - 355 41 308
ACS acquisition-related costs - - - - 58 49 -
ACS shareholders’ litigation settlement - - - - 36 - -
Venezuelan devaluation costs - - - - 21 - -
Medicare subsidy tax law change - - - - 16 - -
Provision for litigation matters - - - - - - 491
Equipment write-off - - - - - - 24
Settlement of unrecognized tax benefits - - - - - - (41)
203 0.15 268 0.18 690 128 817
Adjusted $ 1,398 $ 1.03 $ 1,563 $ 1.08 $ 1,296 $ 613 $ 1,047
Weighted average shares for reported EPS 1,329 1,444
Weighted average shares for adjusted EPS 1,356 1,444
Operating Margin (in millions) Year Ended December 31,
2012 2011 2010 2009 2008
Total Revenues $22,390 $22,626 $21,633 $15,179 $17,608
Pre-tax Income (loss) $1,348 $1,565 $815 $627 $(79)
Adjustments:
Amortization of intangible assets 328 398 312 60 54
Xerox restructuring charge 153 33 483 (8) 429
Curtailment gain - (107) - - -
ACS acquisition-related costs - - 77 72 -
Equipment write-off - - - - 39
Other expenses, net 256 322 389 285 1,033
Adjusted Operating Income $2,085 $2,211 $2,076 $1,036 $1,476
Pre-tax Income Margin 6.0% 6.9% 3.8% 4.1% (0.4%)
Adjusted Operating Margin 9.3% 9.8% 9.6% 6.8% 8.4%
Adjusted Net Cash from Operating Activities (in millions) Year Ended December 31, 2008
Operating Cash Flow – As Reported $939
Adjustments:
Payments for securities litigation 615
Operating Cash Flow – As Adjusted $1,554