Xerox 2012 Annual Report Download - page 117
Download and view the complete annual report
Please find page 117 of the 2012 Xerox annual report below. You can navigate through the pages in the report by either clicking on the pages listed below, or by using the keyword search tool below to find specific information within the annual report.-
 1
1 -
2
-
3
-
4
-
5
-
6
-
7
-
8
-
9
-
10
-
11
-
12
-
13
-
14
-
15
-
16
-
17
-
18
-
19
-
20
-
21
-
22
-
23
-
24
-
25
-
26
-
27
-
28
-
29
-
30
-
31
-
32
-
33
-
34
-
35
-
36
-
37
-
38
-
39
-
40
-
41
-
42
-
43
-
44
-
45
-
46
-
47
-
48
-
49
-
50
-
51
-
52
-
53
-
54
-
55
-
56
-
57
-
58
-
59
-
60
-
61
-
62
-
63
-
64
-
65
-
66
-
67
-
68
-
69
-
70
-
71
-
72
-
73
-
74
-
75
-
76
-
77
-
78
-
79
-
80
-
81
-
82
-
83
-
84
-
85
-
86
-
87
-
88
-
89
-
90
-
91
-
92
-
93
-
94
-
95
-
96
-
97
-
98
-
99
-
100
-
101
-
102
-
103
-
104
-
105
-
106
-
 107
107 -
 108
108 -
 109
109 -
 110
110 -
 111
111 -
 112
112 -
 113
113 -
 114
114 -
 115
115 -
 116
116 -
 117
117 -
 118
118 -
 119
119 -
 120
120
 |
 |

115Xerox 2012 Annual Report
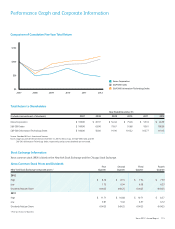
Performance Graph and Corporate Information
Total Return to Shareholders
Year Ended December 31,
(Includes reinvestment of dividends) 2007 2008 2009 2010 2011 2012
Xerox Corporation $ 100.00 $ 49.97 $ 54.46 $ 75.46 $ 53.16 $ 46.59
S&P 500 Index $ 100.00 63.00 79.67 91.68 93.61 108.59
S&P 500 Information Technology Index $ 100.00 56.86 91.96 101.32 103.77 119.15
Source: Standard & Poor’s Investment Services
Notes: Graph assumes $100 invested on December 31, 2007 in Xerox Corp., the S&P 500 Index and the
S&P 500 Information Technology Index, respectively, and assumes dividends are reinvested.
Comparison of Cumulative Five-Year Total Return
$150
$100
$50
$0
2007 2008 2009 2010 2011 2012
Xerox Corporation
S&P 500 Index
S&P 500 Information Technology Index
Stock Exchange Information
Xerox common stock (XRX) is listed on the New York Stock Exchange and the Chicago Stock Exchange.
Xerox Common Stock Prices and Dividends
First Second Third Fourth
New York Stock Exchange composite prices * Quarter Quarter Quarter Quarter
2012
High $ 8.76 $ 8.15 $ 7.94 $ 7.39
Low 7.73 6.94 6.38 6.23
Dividends Paid per Share 0.0425 0.0425 0.0425 0.0425
2011
High $ 11.71 $ 10.88 $ 10.71 $ 8.57
Low 9.87 9.40 6.97 6.72
Dividends Paid per Share 0.0425 0.0425 0.0425 0.0425
* Price as of close of business