Xerox 2012 Annual Report Download - page 48
Download and view the complete annual report
Please find page 48 of the 2012 Xerox annual report below. You can navigate through the pages in the report by either clicking on the pages listed below, or by using the keyword search tool below to find specific information within the annual report.-
 1
1 -
2
-
3
-
4
-
5
-
6
-
7
-
8
-
9
-
10
-
11
-
12
-
13
-
14
-
15
-
16
-
17
-
18
-
19
-
20
-
21
-
22
-
23
-
24
-
25
-
26
-
27
-
28
-
29
-
30
-
31
-
32
-
33
-
34
-
35
-
36
-
37
-
 38
38 -
 39
39 -
 40
40 -
 41
41 -
 42
42 -
 43
43 -
 44
44 -
 45
45 -
 46
46 -
 47
47 -
 48
48 -
 49
49 -
 50
50 -
 51
51 -
 52
52 -
 53
53 -
 54
54 -
 55
55 -
 56
56 -
 57
57 -
 58
58 -
59
-
60
-
61
-
62
-
63
-
64
-
65
-
66
-
67
-
68
-
69
-
70
-
71
-
72
-
73
-
74
-
75
-
76
-
77
-
78
-
79
-
80
-
81
-
82
-
83
-
84
-
85
-
86
-
87
-
88
-
89
-
90
-
91
-
92
-
93
-
94
-
95
-
96
-
97
-
98
-
99
-
100
-
101
-
102
-
103
-
104
-
105
-
106
-
107
-
108
-
109
-
110
-
111
-
112
-
113
-
114
-
115
-
116
-
117
-
118
-
119
-
120
 |
 |
Management’s Discussion
46
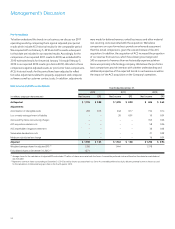
In 2013, we expect to continue the leveraging of our finance assets at
an assumed 7:1 ratio of debt to equity. We also may sell or securitize
certain finance receivables as another means to support our customer
financing activities – see discussion further below of finance receivable
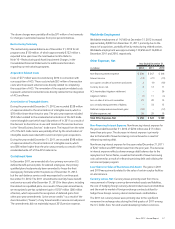
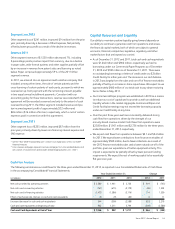
sale activity in 2012. The following summarizes our total debt at
December 31, 2012 and 2011:
December 31,
(in millions) 2012 2011
Principal debt balance (1) $ 8,410 $ 8,450
Net unamortized discount (63) (7)
Fair value adjustments 142 190
Total Debt $ 8,489 $ 8,633
(1) Includes Commercial Paper of $0 and $100 million as of December 31, 2012 and 2011,
respectively.
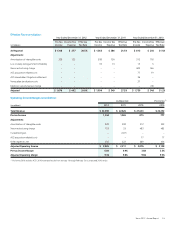
Sales of Accounts Receivable
Accounts receivable sales arrangements are utilized in the normal
course of business as part of our cash and liquidity management. We
have facilities in the U.S., Canada and several countries in Europe that
enable us to sell certain accounts receivables without recourse to third-
parties. The accounts receivables sold are generally short-term trade
receivables with payment due dates of less than 60 days.
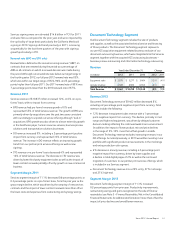
Accounts receivables sales were as follows:
Year ended December 31,
(in millions) 2012 2011 2010
Accounts receivable sales $ 3,699 $ 3,218 $ 2,374
Deferred proceeds 639 386 307
Loss on sale of accounts receivable 21 20 15
Estimated (decrease) increase to
operating cash flows (1) (78) 133 106
(1) Represents the difference between current and prior year fourth quarter receivable sales
adjusted for the effects of: (i) the deferred proceeds, (ii) collections prior to the end of the
year, and (iii) currency.
Refer to Note 4 – Accounts Receivables, Net in the Consolidated
Financial Statements for additional information.
Sales of Finance Receivables
In 2012, we sold our entire interest in two separate portfolios of U.S.
finance receivables from our Document Technology segment with a
combined net carrying value of $682 million to a third-party financial
institution for cash proceeds of $630 million and beneficial interests
from the purchaser of $101 million. These transactions enable us to
lower the cost associated with our financing portfolio.
A pre-tax gain of $44 million was recognized on these sales and is net
of additional fees and expenses of $5 million. The gain was reported in
Finance income in Document Technology segment revenues. We will
continue to service the sold receivables and expect to a record servicing
fee income of approximately $12 million over the expected life of the
associated receivables.
Refer to Note 5 – Finance Receivables, Net in the Consolidated
Financial Statements for additional information.
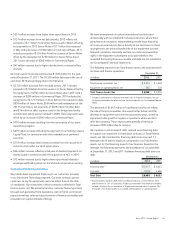
The net impact on operating cash flows from the sales of accounts
receivable and finance receivables is summarized below:
Year ended December 31,
(in millions) 2012 2011 2010
Cash received from finance receivables sales $ 625 $ – $ –
Collections on sold finance receivables (1) (45) – –
Net cash impact of finance receivable sales 580 – –
Net cash impact of accounts receivable sales (78) 133 106
Net Cash Impact On Cash Flows
From Operating Activities $ 502 $ 133 $ 106
(1) Represents cash that would have been collected if we had not sold finance receivables.
Capital Market Activity
Debt Exchange
In February 2012, we completed an exchange of our 5.71% Zero
Coupon Notes due 2023 with an accreted book value at the date of the
exchange of $303 million, for $362 million of our 4.50% Senior Notes
due 2021. Accordingly, this increased the principal amount for our
4.50% Senior Notes due 2021 from $700 million to $1,062 million. The
exchange was conducted to retire high-interest, long-dated debt in a
favorable interest rate environment. The debt exchange was accounted
for as a non-revolving debt modification and, therefore, it did not result
in any gain or loss. The difference between the book value of our Zero
Coupon Notes and the principal value of the Senior Notes issued in
exchange will be accreted over the remaining term of the Senior Notes.
Upfront fees paid to third parties in connection with the exchange were
not material and were expensed as incurred.
Senior Notes
In March 2012, we issued $600 million of Floating Rate Senior Notes
due 2013 (the “2013 Floating Rate Notes”) and $500 million of 2.95%
Senior Notes due 2017 (the “2017 Senior Notes”). The 2013 Floating
Rate Notes were issued at par and the 2017 Senior Notes were issued
at 99.875% of par, resulting in aggregate net proceeds for both notes
of approximately $1,093 million. The 2013 Floating Rate Notes accrue
interest at a rate per annum, reset quarterly, equal to the three-month
LIBOR plus 1.400% and are payable quarterly. The 2017 Senior Notes
accrue interest at a rate of 2.95% per annum and are payable semi-
annually. As a result of the discount, they have a weighted average
effective interest rate of 2.977%. In connection with the issuance of