Xerox 2012 Annual Report Download - page 109
Download and view the complete annual report
Please find page 109 of the 2012 Xerox annual report below. You can navigate through the pages in the report by either clicking on the pages listed below, or by using the keyword search tool below to find specific information within the annual report.-
 1
1 -
2
-
3
-
4
-
5
-
6
-
7
-
8
-
9
-
10
-
11
-
12
-
13
-
14
-
15
-
16
-
17
-
18
-
19
-
20
-
21
-
22
-
23
-
24
-
25
-
26
-
27
-
28
-
29
-
30
-
31
-
32
-
33
-
34
-
35
-
36
-
37
-
38
-
39
-
40
-
41
-
42
-
43
-
44
-
45
-
46
-
47
-
48
-
49
-
50
-
51
-
52
-
53
-
54
-
55
-
56
-
57
-
58
-
59
-
60
-
61
-
62
-
63
-
64
-
65
-
66
-
67
-
68
-
69
-
70
-
71
-
72
-
73
-
74
-
75
-
76
-
77
-
78
-
79
-
80
-
81
-
82
-
83
-
84
-
85
-
86
-
87
-
88
-
89
-
90
-
91
-
92
-
93
-
94
-
95
-
96
-
97
-
98
-
 99
99 -
 100
100 -
 101
101 -
 102
102 -
 103
103 -
 104
104 -
 105
105 -
 106
106 -
 107
107 -
 108
108 -
 109
109 -
 110
110 -
 111
111 -
 112
112 -
 113
113 -
 114
114 -
 115
115 -
 116
116 -
 117
117 -
 118
118 -
 119
119 -
120
 |
 |

107Xerox 2012 Annual Report
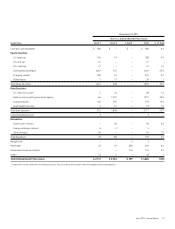
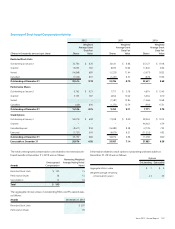
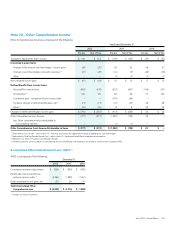
The total unrecognized compensation cost related to non-vested stock-
based awards at December 31, 2012 was as follows:
Remaining Weighted-
Unrecognized Average Vesting Period
Awards Compensation (Years)
Restricted Stock Units $ 125 1.5
Performance Shares 58 1.5
Stock Options 12 1.6
Total $ 195
The aggregate intrinsic value of outstanding RSUs and PSs awards was
as follows:
Awards December 31, 2012
Restricted Stock Units $ 207
Performance Shares 99
Information related to stock options outstanding and exercisable at
December 31, 2012 was as follows:
Options
Outstanding Exercisable
Aggregate intrinsic value $ 7 $ 5
Weighted-average remaining
contractual life (years) 4.3 3.9
Summary of Stock-based Compensation Activity
2012 2011 2010
Weighted Weighted Weighted
Average Grant Average Grant Average Grant
Date Fair Date Fair Date Fair
(Shares in thousands; amounts per share) Shares Value Shares Value Shares Value
Restricted Stock Units
Outstanding at January 1 33,784 $ 8.70 32,431 $ 8.68 25,127 $ 10.18
Granted 13,033 7.82 8,035 10.66 11,845 8.56
Vested (14,848) 6.89 (5,225) 11.64 (3,671) 18.22
Cancelled (1,555) 8.97 (1,457) 8.57 (870) 10.36
Outstanding at December 31 30,414 9.19 33,784 8.70 32,431 8.68
Performance Shares
Outstanding at January 1 9,763 $ 9.21 7,771 $ 9.78 4,874 $ 15.49
Granted 5,193 7.87 4,852 10.42 5,364 8.10
Vested – – (1,587) 12.84 (1,566) 18.48
Cancelled (420) 8.96 (1,273) 12.79 (901) 15.51
Outstanding at December 31 14,536 8.74 9,763 9.21 7,771 9.78
Stock Options
Outstanding at January 1 50,070 $ 6.98 71,038 $ 8.00 28,363 $ 10.13
Granted – – – – 96,662 6.79
Cancelled/expired (8,617) 8.58 (14,889) 8.38 (2,735) 7.33
Exercised (7,721) 5.69 (6,079) 8.21 (51,252) 6.92
Outstanding at December 31 33,732 6.86 50,070 6.98 71,038 8.00
Exercisable at December 31 28,676 6.95 39,987 7.14 57,985 8.38