Xerox 2012 Annual Report Download - page 60
Download and view the complete annual report
Please find page 60 of the 2012 Xerox annual report below. You can navigate through the pages in the report by either clicking on the pages listed below, or by using the keyword search tool below to find specific information within the annual report.-
 1
1 -
2
-
3
-
4
-
5
-
6
-
7
-
8
-
9
-
10
-
11
-
12
-
13
-
14
-
15
-
16
-
17
-
18
-
19
-
20
-
21
-
22
-
23
-
24
-
25
-
26
-
27
-
28
-
29
-
30
-
31
-
32
-
33
-
34
-
35
-
36
-
37
-
38
-
39
-
40
-
41
-
42
-
43
-
44
-
45
-
46
-
47
-
48
-
49
-
 50
50 -
 51
51 -
 52
52 -
 53
53 -
 54
54 -
 55
55 -
 56
56 -
 57
57 -
 58
58 -
 59
59 -
 60
60 -
 61
61 -
 62
62 -
 63
63 -
 64
64 -
 65
65 -
 66
66 -
 67
67 -
 68
68 -
 69
69 -
 70
70 -
71
-
72
-
73
-
74
-
75
-
76
-
77
-
78
-
79
-
80
-
81
-
82
-
83
-
84
-
85
-
86
-
87
-
88
-
89
-
90
-
91
-
92
-
93
-
94
-
95
-
96
-
97
-
98
-
99
-
100
-
101
-
102
-
103
-
104
-
105
-
106
-
107
-
108
-
109
-
110
-
111
-
112
-
113
-
114
-
115
-
116
-
117
-
118
-
119
-
120
 |
 |

58
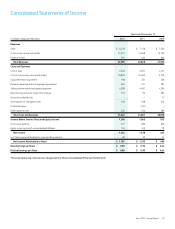
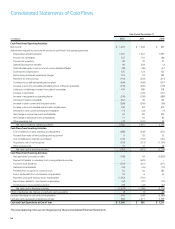
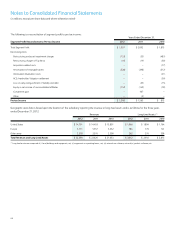
Consolidated Statements of Cash Flows
58
Year Ended December 31,
(in millions) 2012 2011 2010
Cash Flows from Operating Activities:
Net income $ 1,223 $ 1,328 $ 637
Adjustments required to reconcile net income to cash flows from operating activities:
Depreciation and amortization 1,301 1,251 1,097
Provision for receivables 127 154 180
Provision for inventory 30 39 31
Deferred tax expense (benefit) 96 203 (2)
Undistributed equity in net income of unconsolidated affiliates (90) (86) (37)
Stock-based compensation 125 123 123
Restructuring and asset impairment charges 153 33 483
Payments for restructurings (144) (218) (213)
Contributions to defined benefit pension plans (364) (426) (237)
Increase in accounts receivable and billed portion of finance receivables (776) (296) (118)
Collections of deferred proceeds from sales of receivables 470 380 218
Increase in inventories – (124) (151)
Increase in equipment on operating leases (276) (298) (288)
Decrease in finance receivables 947 90 129
Increase in other current and long-term assets (265) (249) (98)
Increase in accounts payable and accrued compensation 120 82 615
Decrease in other current and long-term liabilities (71) (22) (9)
Net change in income tax assets and liabilities 42 89 229
Net change in derivative assets and liabilities 11 39 85
Other operating, net (79) (131) 52
Net cash provided by operating activities 2,580 1,961 2,726
Cash Flows from Investing Activities:
Cost of additions to land, buildings and equipment (388) (338) (355)
Proceeds from sales of land, buildings and equipment 9 28 52
Cost of additions to internal use software (125) (163) (164)
Acquisitions, net of cash acquired (276) (212) (1,734)
Other investing, net 19 10 23
Net cash used in investing activities (761) (675) (2,178)
Cash Flows from Financing Activities:
Net (payments) proceeds on debt (108) 49 (3,056)
Payment of liability to subsidiary trust issuing preferred securities – (670) –
Common stock dividends (231) (241) (215)
Preferred stock dividends (24) (24) (15)
Proceeds from issuances of common stock 44 44 183
Excess tax benefits from stock-based compensation 10 6 24
Payments to acquire treasury stock, including fees (1,052) (701) –
Repurchases related to stock-based compensation (42) (27) (15)
Distributions to noncontrolling interests (69) (22) (22)
Net cash used in financing activities (1,472) (1,586) (3,116)
Effect of exchange rate changes on cash and cash equivalents (3) (9) (20)
Increase (decrease) in cash and cash equivalents 344 (309) (2,588)
Cash and cash equivalents at beginning of year 902 1,211 3,799
Cash and Cash Equivalents at End of Year $ 1,246 $ 902 $ 1,211
The accompanying notes are an integral part of these Consolidated Financial Statements.