Xerox 2012 Annual Report Download - page 81
Download and view the complete annual report
Please find page 81 of the 2012 Xerox annual report below. You can navigate through the pages in the report by either clicking on the pages listed below, or by using the keyword search tool below to find specific information within the annual report.-
 1
1 -
2
-
3
-
4
-
5
-
6
-
7
-
8
-
9
-
10
-
11
-
12
-
13
-
14
-
15
-
16
-
17
-
18
-
19
-
20
-
21
-
22
-
23
-
24
-
25
-
26
-
27
-
28
-
29
-
30
-
31
-
32
-
33
-
34
-
35
-
36
-
37
-
38
-
39
-
40
-
41
-
42
-
43
-
44
-
45
-
46
-
47
-
48
-
49
-
50
-
51
-
52
-
53
-
54
-
55
-
56
-
57
-
58
-
59
-
60
-
61
-
62
-
63
-
64
-
65
-
66
-
67
-
68
-
69
-
70
-
 71
71 -
 72
72 -
 73
73 -
 74
74 -
 75
75 -
 76
76 -
 77
77 -
 78
78 -
 79
79 -
 80
80 -
 81
81 -
 82
82 -
 83
83 -
 84
84 -
 85
85 -
 86
86 -
 87
87 -
 88
88 -
 89
89 -
 90
90 -
 91
91 -
92
-
93
-
94
-
95
-
96
-
97
-
98
-
99
-
100
-
101
-
102
-
103
-
104
-
105
-
106
-
107
-
108
-
109
-
110
-
111
-
112
-
113
-
114
-
115
-
116
-
117
-
118
-
119
-
120
 |
 |
79Xerox 2012 Annual Report
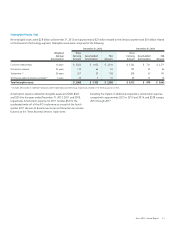
Useful lives of our internal use and product software generally vary from
three to ten years. Included within product software is approximately
$200 of capitalized costs associated with a software system developed
for use in certain of our government services businesses.
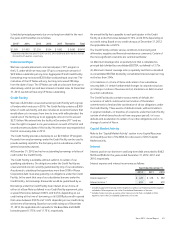
Our 2012 impairment review indicated these costs will be recoverable
from estimated future operating profits. However, since the review
indicated that the excess of estimated future operating profits over
capitalized costs was less than 5%; in 2013 we will continue to closely
monitor any significant changes in the estimated future revenues or
margins from current or potential customers. Beginning in 2013, the
costs associated with this software system will be amortized over seven
years.
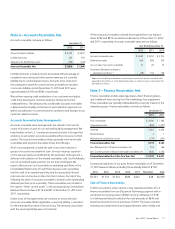
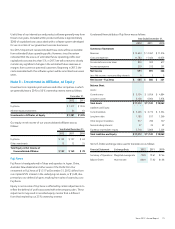
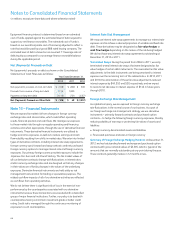
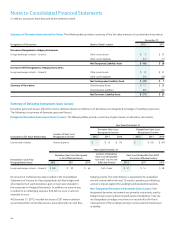
Note 8 – Investment in Affiliates, at Equity
Investments in corporate joint ventures and other companies in which
we generally have a 20% to 50% ownership interest were as follows:
December 31,
2012 2011
Fuji Xerox $ 1,317 $ 1,334
All other equity investments 64 61
Investments in Affiliates, at Equity $ 1,381 $ 1,395
Our equity in net income of our unconsolidated affiliates was as
follows:
Year Ended December 31,
2012 2011 2010
Fuji Xerox $ 139 $ 137 $ 63
Other investments 13 12 15
Total Equity in Net Income of
Unconsolidated Affiliates $ 152 $ 149 $ 78
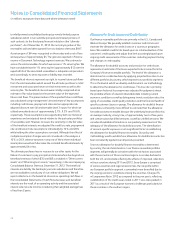
Fuji Xerox
Fuji Xerox is headquartered in Tokyo and operates in Japan, China,
Australia, New Zealand and other areas of the Pacific Rim. Our
investment in Fuji Xerox of $1,317 at December 31, 2012, differs from
our implied 25% interest in the underlying net assets, or $1,430, due
primarily to our deferral of gains resulting from sales of assets by us to
Fuji Xerox.
Equity in net income of Fuji Xerox is affected by certain adjustments to
reflect the deferral of profit associated with intercompany sales. These
adjustments may result in recorded equity income that is different
from that implied by our 25% ownership interest.
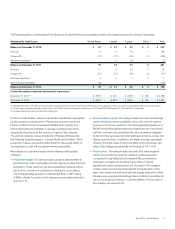
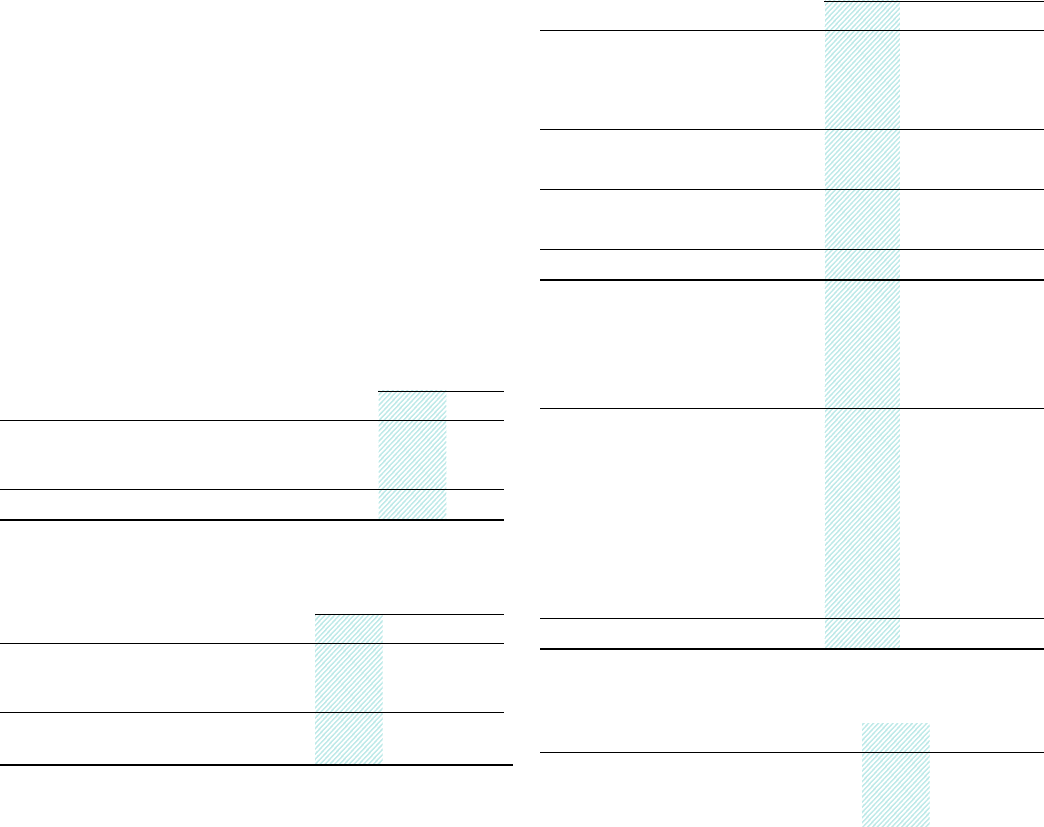
Condensed financial data of Fuji Xerox was as follows:
Year Ended December 31,
2012 2011 2010
Summary of Operations
Revenues $ 12,633 $ 12,367 $ 11,276
Costs and expenses 11,783 11,464 10,659
Income before income taxes 850 903 617
Income tax expense 279 312 291
Net Income 571 591 326
Less: Net income – noncontrolling interests 6 5 5
Net Income – Fuji Xerox $ 565 $ 586 $ 321
Balance Sheet
Assets:
Current assets $ 5,154 $ 5,056 $ 4,884
Long-term assets 6,158 6,064 5,978
Total Assets $11,312 $11,120 $10,862
Liabilities and Equity:
Current liabilities $ 3,465 $ 3,772 $ 3,534
Long-term debt 1,185 817 1,260
Other long-term liabilities 917 700 707
Noncontrolling interests 27 25 22
Fuji Xerox shareholders’ equity 5,718 5,806 5,339
Total Liabilities and Equity $11,312 $11,120 $10,862
Yen/U.S. Dollar exchange rates used to translate are as follows:
Financial Statement Exchange Basis 2012 2011 2010
Summary of Operations Weighted average rate 79.89 79.61 87.64
Balance Sheet Year-end rate 86.01 77.62 81.66