Xerox 2012 Annual Report Download - page 74
Download and view the complete annual report
Please find page 74 of the 2012 Xerox annual report below. You can navigate through the pages in the report by either clicking on the pages listed below, or by using the keyword search tool below to find specific information within the annual report.-
 1
1 -
2
-
3
-
4
-
5
-
6
-
7
-
8
-
9
-
10
-
11
-
12
-
13
-
14
-
15
-
16
-
17
-
18
-
19
-
20
-
21
-
22
-
23
-
24
-
25
-
26
-
27
-
28
-
29
-
30
-
31
-
32
-
33
-
34
-
35
-
36
-
37
-
38
-
39
-
40
-
41
-
42
-
43
-
44
-
45
-
46
-
47
-
48
-
49
-
50
-
51
-
52
-
53
-
54
-
55
-
56
-
57
-
58
-
59
-
60
-
61
-
62
-
63
-
 64
64 -
 65
65 -
 66
66 -
 67
67 -
 68
68 -
 69
69 -
 70
70 -
 71
71 -
 72
72 -
 73
73 -
 74
74 -
 75
75 -
 76
76 -
 77
77 -
 78
78 -
 79
79 -
 80
80 -
 81
81 -
 82
82 -
 83
83 -
 84
84 -
85
-
86
-
87
-
88
-
89
-
90
-
91
-
92
-
93
-
94
-
95
-
96
-
97
-
98
-
99
-
100
-
101
-
102
-
103
-
104
-
105
-
106
-
107
-
108
-
109
-
110
-
111
-
112
-
113
-
114
-
115
-
116
-
117
-
118
-
119
-
120
 |
 |
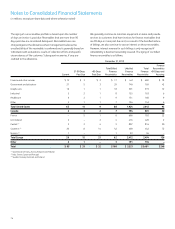
Notes to Consolidated Financial Statements
(in millions, except per-share data and where otherwise noted)
72
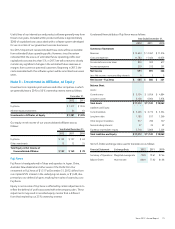
to wholly-owned consolidated bankruptcy-remote limited purpose
subsidiaries which in turn sold the principal and interest portions of
such contracts to the third-party financial institution (the “ultimate
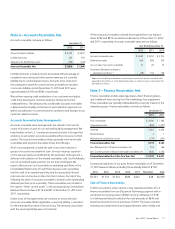
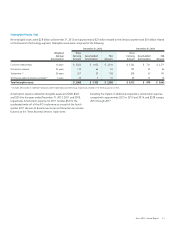
purchaser”). As of December 31, 2012, the net carrying value of the
receivables sold and derecognized from our balance sheet was $647.
A pre-tax gain of $44 was recognized on these sales and is net of fees
and expenses of approximately $5. The gain was reported in Finance
income in Document Technology segment revenues. We continue to
service the sold receivables for which we receive a 1% servicing fee. We
have concluded that the 1% servicing fee (approximately $12 over the
expected life of the associated receivables) is adequate compensation
and, accordingly, no servicing asset or liability was recorded.
The beneficial interests represent our right to receive future cash flows
from the sold receivables which exceed the ultimate purchaser’s initial
investment and associated return on that investment as well as the
servicing fee. The beneficial interests were initially recognized at an
estimate of fair value based on the present value of the expected
future cash flows. The present value of the expected future cash flows
was calculated using management’s best estimate of key assumptions
including credit losses, prepayment rates and an appropriate risk-
adjusted discount rate (all unobservable Level 3 inputs) for which we
utilized annualized rates of approximately 2.1%, 9.3% and 10.0%,
respectively. These assumptions are supported by both our historical
experience and anticipated trends relative to the particular portfolios
of receivables sold. However, to assess the sensitivity on the fair value
of the beneficial interests, we adjusted the credit loss rate, prepayment
rate and discount rate assumptions individually by 10% and 20%
while holding the other assumptions constant. Although the effect of
multiple assumption changes was not considered in this analysis, a
10% or 20% adverse variation in any one of these three individual
assumptions would each decrease the recorded beneficial interests by
approximately $4 or less.
The ultimate purchaser has no recourse to our other assets for the
failure of customers to pay principal and interest when due beyond our
beneficial interests of which $35 and $68 is included in “Other current
assets” and “Other long-term assets,” respectively, in the accompanying
Consolidated Balance Sheets at December 31, 2012. The beneficial
interests are held by the bankruptcy-remote subsidiaries and therefore
are not available to satisfy any of our creditor obligations. We will
report collections on the beneficial interests as operating cash flows in
the Consolidated Statements of Cash Flows because such beneficial
interests are the result of an operating activity and the associated
interest rate risk is de minimis considering their weighted average lives
of less than 2 years.
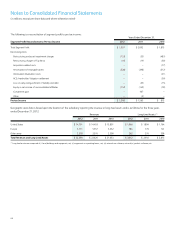
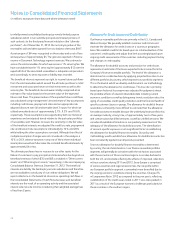
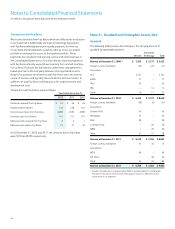
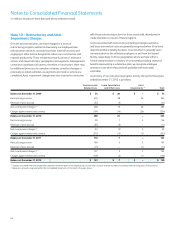
Allowance for Credit Losses and Credit Quality
Our finance receivable portfolios are primarily in the U.S., Canada and
Western Europe. We generally establish customer credit limits and
estimate the allowance for credit losses on a country or geographic
basis. We establish credit limits based upon an initial evaluation of the
customer’s credit quality and adjust that limit accordingly based upon
ongoing credit assessments of the customer, including payment history
and changes in credit quality.
The allowance for doubtful accounts and provision for credit losses
represents an estimate of the losses expected to be incurred from the
Company’s finance receivable portfolio. The level of the allowance is
determined on a collective basis by applying projected loss rates to our
different portfolios by country, which represent our portfolio segments.
This is the level at which we develop and document our methodology
to determine the allowance for credit losses. This loss rate is primarily
based upon historical loss experiences adjusted for judgments about
the probable effects of relevant observable data including current
economic conditions as well as delinquency trends, resolution rates, the
aging of receivables, credit quality indicators and the financial health of
specific customer classes or groups. The allowance for doubtful finance
receivables is inherently more difficult to estimate than the allowance
for trade accounts receivable because the underlying lease portfolio has
an average maturity, at any time, of approximately two to three years
and contains past due billed amounts, as well as unbilled amounts. We
consider all available information in our quarterly assessments of the
adequacy of the allowance for doubtful accounts. The identification
of account-specific exposure is not a significant factor in establishing
the allowance for doubtful finance receivables. Our policy and
methodology used to establish our allowance for doubtful accounts has
been consistently applied over all periods presented.
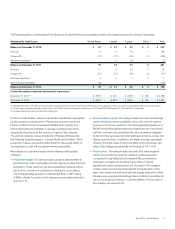
Since our allowance for doubtful finance receivables is determined
by country, the risk characteristics in our finance receivable portfolio
segments will generally be consistent with the risk factors associated
with the economies of those countries/regions. Loss rates declined in
both the U.S. and Canada reflecting the effects of improved collections
in those countries during 2011 and 2012. Since Europe is comprised
of various countries and regional economies, the risk profile within
our European portfolio segment is somewhat more diversified due to
the varying economic conditions among the countries. Charge-offs
in Europe were flat in 2012 as compared to the prior year’s, reflecting
a stabilization of the credit issues noted in 2011. Loss rates peaked in
2011 as a result of the European economic challenges particularly for
those countries in the southern region.