Xerox 2012 Annual Report Download - page 30
Download and view the complete annual report
Please find page 30 of the 2012 Xerox annual report below. You can navigate through the pages in the report by either clicking on the pages listed below, or by using the keyword search tool below to find specific information within the annual report.-
 1
1 -
2
-
3
-
4
-
5
-
6
-
7
-
8
-
9
-
10
-
11
-
12
-
13
-
14
-
15
-
16
-
17
-
18
-
19
-
 20
20 -
 21
21 -
 22
22 -
 23
23 -
 24
24 -
 25
25 -
 26
26 -
 27
27 -
 28
28 -
 29
29 -
 30
30 -
 31
31 -
 32
32 -
 33
33 -
 34
34 -
 35
35 -
 36
36 -
 37
37 -
 38
38 -
 39
39 -
 40
40 -
41
-
42
-
43
-
44
-
45
-
46
-
47
-
48
-
49
-
50
-
51
-
52
-
53
-
54
-
55
-
56
-
57
-
58
-
59
-
60
-
61
-
62
-
63
-
64
-
65
-
66
-
67
-
68
-
69
-
70
-
71
-
72
-
73
-
74
-
75
-
76
-
77
-
78
-
79
-
80
-
81
-
82
-
83
-
84
-
85
-
86
-
87
-
88
-
89
-
90
-
91
-
92
-
93
-
94
-
95
-
96
-
97
-
98
-
99
-
100
-
101
-
102
-
103
-
104
-
105
-
106
-
107
-
108
-
109
-
110
-
111
-
112
-
113
-
114
-
115
-
116
-
117
-
118
-
119
-
120
 |
 |
Management’s Discussion
28
In addition, during 2012 we acquired companies that expand our
distribution capacity for Xerox document technology to small and
mid-sized businesses (“SMB”) and in under-penetrated markets. These
acquisitions include R.K. Dixon, a leading provider of IT services,
printers and managed print services, with locations in seven Iowa and
Illinois cities. We also enhanced our distribution capabilities by acquiring
office products distributors in Wisconsin, California and Illinois.
Financial Overview
During 2012 we focused on aligning our costs, investments, diverse
portfolio and operations with our services-led strategy that is designed
to accelerate growth in Services while maximizing the profitability of
our Document Technology business.
Total revenue of $22.4 billion in 2012 declined 1% from the prior
year, with a 1-percentage point negative impact from currency. Total
revenue reflected 6% growth in our Services segment as a result
of strong performance in BPO, ITO and DO services. Document
Technology revenues in 2012 declined 8% from the prior year and
included a 2-percentage point negative impact from currency.
Document Technology revenues in 2012 continued to be impacted
by the weak macro-economic environment as well as an increasing
migration of customers to our managed print services.
Net income attributable to Xerox for 2012 was $1,195 million and
included $316 million of after-tax costs and expenses related to the
amortization of intangible assets and restructuring. Net income for
2012 reflects continued pressure on margins, as we scale our revenue
in Services and ramp-up new contracts, partially offset by operational
improvements and cost reductions from restructuring actions. We
incurred additional pre-tax restructuring charges of $120 million in
2012 as compared to 2011 as we actively manage our cost structure
to improve profitability and better align it with our services-focused
business model. Net income attributable to Xerox for 2011 was
$1,295 million and included $305 million of after-tax costs and
expenses related to the amortization of intangible assets, restructuring
and the loss on the early extinguishment of a long-term liability, which
were partially offset by an after-tax curtailment gain of $66 million.
Cash flow from operations was $2.6 billion in 2012 as compared to
$2.0 billion in 2011. The increase in cash was primarily due to the sales
of receivables as well as a higher net runoff of finance receivables as
a result of lower equipment sales. This increase was partially offset by
higher accounts receivables primarily due to the growth in Services
revenue. Cash used in investing activities of $761 million primarily
reflects capital expenditures of $513 million and acquisitions of
$276 million. Cash used in financing activities was $1.5 billion, which
primarily reflects $1.1 billion for the repurchase of common stock,
$255 million for dividends and a $100 million reduction in Commercial
Paper. We also issued approximately $1.1 billion in new Senior Notes to
fund the May 2012 maturity of our $1.1 billion 5.59% Senior Notes.
We expect 2013 revenue in the range of flat to growing 2%, excluding
the impact of currency. In our Services business, we expect continued
revenue growth in the mid-to-high single digits. Services margins are
expected to be in the 10%-12% range as the Company places a
heightened focus on operational efficiencies and applying innovation
to automate more business processes. In our Document Technology
business, we expect a mid-single digit revenue decline, an improvement
from the prior year. The Company expects to benefit from product
launches and the expansion of indirect channels plus the acceleration
of color printing in key markets, all of which partially offset declines
primarily related to black-and-white printing. Margins in Document
Technology are expected to be flat on a year-over-year basis, continuing
to support the strong profitability of this mature business and providing
flexibility to accelerate growth in the digital color and SMB markets.
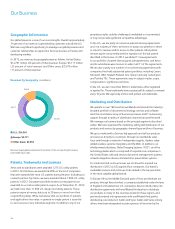
Europe
As of and for the year ended December 31, 2012, approximately
$3.1 billion of our total revenues and $4.1 billion of our total assets
are based in countries where the Euro is the functional currency.
Approximately $1.8 billion of those assets are finance receivables
and approximately 15% of those receivables are with governmental
entities. Accordingly, we are impacted by the challenges facing the Euro
zone economies and governments, and we expect those challenges to
continue into 2013.
Currency Impact
To understand the trends in the business, we believe that it is helpful to
analyze the impact of changes in the translation of foreign currencies
into U.S. Dollars on revenue and expenses. We refer to this analysis
as “currency impact” or “the impact from currency.” This impact is
calculated by translating current period activity in local currency using
the comparable prior year period’s currency translation rate. This
impact is calculated for all countries where the functional currency
is the local country currency. Revenues and expenses from our
developing market countries (Latin America, Brazil, the Middle East,
India, Eurasia and Central-Eastern Europe) are analyzed at actual
exchange rates for all periods presented, since these countries generally
have unpredictable currency and inflationary environments, and our
operations in these countries have historically implemented pricing
actions to recover the impact of inflation and devaluation. We do not
hedge the translation effect of revenues or expenses denominated in
currencies where the local currency is the functional currency.
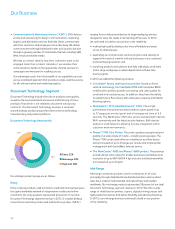
Approximately 34% of our consolidated revenues are derived
from operations outside of the United States where the U.S. Dollar
is normally not the functional currency. When compared with the
average of the major European currencies and Canadian Dollar on a
revenue-weighted basis, the U.S. Dollar was 5% stronger in 2012 and
5% weaker in 2011, each compared to the prior year. As a result, the
foreign currency translation impact on revenue was a 1% detriment in
2012 and a 2% benefit in 2011.