Xerox 2012 Annual Report Download - page 70
Download and view the complete annual report
Please find page 70 of the 2012 Xerox annual report below. You can navigate through the pages in the report by either clicking on the pages listed below, or by using the keyword search tool below to find specific information within the annual report.-
 1
1 -
2
-
3
-
4
-
5
-
6
-
7
-
8
-
9
-
10
-
11
-
12
-
13
-
14
-
15
-
16
-
17
-
18
-
19
-
20
-
21
-
22
-
23
-
24
-
25
-
26
-
27
-
28
-
29
-
30
-
31
-
32
-
33
-
34
-
35
-
36
-
37
-
38
-
39
-
40
-
41
-
42
-
43
-
44
-
45
-
46
-
47
-
48
-
49
-
50
-
51
-
52
-
53
-
54
-
55
-
56
-
57
-
58
-
59
-
 60
60 -
 61
61 -
 62
62 -
 63
63 -
 64
64 -
 65
65 -
 66
66 -
 67
67 -
 68
68 -
 69
69 -
 70
70 -
 71
71 -
 72
72 -
 73
73 -
 74
74 -
 75
75 -
 76
76 -
 77
77 -
 78
78 -
 79
79 -
 80
80 -
81
-
82
-
83
-
84
-
85
-
86
-
87
-
88
-
89
-
90
-
91
-
92
-
93
-
94
-
95
-
96
-
97
-
98
-
99
-
100
-
101
-
102
-
103
-
104
-
105
-
106
-
107
-
108
-
109
-
110
-
111
-
112
-
113
-
114
-
115
-
116
-
117
-
118
-
119
-
120
 |
 |

Notes to Consolidated Financial Statements
(in millions, except per-share data and where otherwise noted)
68
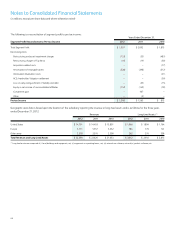
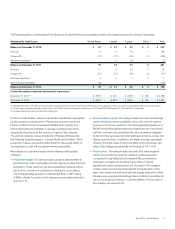
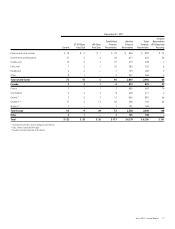
The following is a reconciliation of segment profit to pre-tax income:
Years Ended December 31,
Segment Profit Reconciliation to Pre-tax Income 2012 2011 2010
Total Segment Profit $ 1,997 $ 2,092 $ 1,875
Reconciling items:
Restructuring and asset impairment charges (153) (33) (483)
Restructuring charges of Fuji Xerox (16) (19) (38)
Acquisition-related costs – – (77)
Amortization of intangible assets (328) (398) (312)
Venezuelan devaluation costs – – (21)
ACS shareholders’ litigation settlement – – (36)
Loss on early extinguishment of liability and debt – (33) (15)
Equity in net income of unconsolidated affiliates (152) (149) (78)
Curtailment gain – 107 –
Other – (2) –
Pre-tax Income $ 1,348 $ 1,565 $ 815
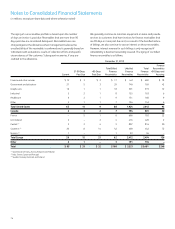
Geographic area data is based upon the location of the subsidiary reporting the revenue or long-lived assets and is as follows for the three years
ended December 31, 2012:
Revenues Long-Lived Assets (1)
2012 2011 2010 2012 2011 2010
United States $ 14,701 $ 14,493 $ 13,801 $ 1,966 $ 1,894 $ 1,764
Europe 5,111 5,557 5,332 784 776 741
Other areas 2,578 2,576 2,500 262 276 309
Total Revenues and Long-Lived Assets $ 22,390 $ 22,626 $ 21,633 $ 3,012 $ 2,946 $ 2,814
(1) Long-lived assets are comprised of (i) land, buildings and equipment, net, (ii) equipment on operating leases, net, (iii) internal use software, net and (iv) product software, net.