Xerox 2012 Annual Report Download - page 116
Download and view the complete annual report
Please find page 116 of the 2012 Xerox annual report below. You can navigate through the pages in the report by either clicking on the pages listed below, or by using the keyword search tool below to find specific information within the annual report.-
 1
1 -
2
-
3
-
4
-
5
-
6
-
7
-
8
-
9
-
10
-
11
-
12
-
13
-
14
-
15
-
16
-
17
-
18
-
19
-
20
-
21
-
22
-
23
-
24
-
25
-
26
-
27
-
28
-
29
-
30
-
31
-
32
-
33
-
34
-
35
-
36
-
37
-
38
-
39
-
40
-
41
-
42
-
43
-
44
-
45
-
46
-
47
-
48
-
49
-
50
-
51
-
52
-
53
-
54
-
55
-
56
-
57
-
58
-
59
-
60
-
61
-
62
-
63
-
64
-
65
-
66
-
67
-
68
-
69
-
70
-
71
-
72
-
73
-
74
-
75
-
76
-
77
-
78
-
79
-
80
-
81
-
82
-
83
-
84
-
85
-
86
-
87
-
88
-
89
-
90
-
91
-
92
-
93
-
94
-
95
-
96
-
97
-
98
-
99
-
100
-
101
-
102
-
103
-
104
-
105
-
 106
106 -
 107
107 -
 108
108 -
 109
109 -
 110
110 -
 111
111 -
 112
112 -
 113
113 -
 114
114 -
 115
115 -
 116
116 -
 117
117 -
 118
118 -
 119
119 -
 120
120
 |
 |

114
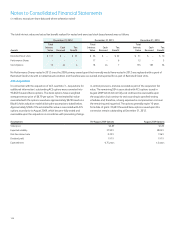
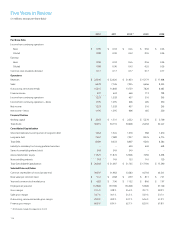
Five Years in Review
(in millions, except per-share data)
2012 2011 2010 (1) 2009 2008
Per-Share Data
Income from continuing operations
Basic $ 0.90 $ 0.92 $ 0.44 $ 0.56 $ 0.26
Diluted 0.88 0.90 0.43 0.55 0.26
Earnings
Basic 0.90 0.92 0.44 0.56 0.26
Diluted 0.88 0.90 0.43 0.55 0.26
Common stock dividends declared 0.17 0.17 0.17 0.17 0.17
Operations
Revenues $ 22,390 $ 22,626 $ 21,633 $ 15,179 $ 17,608
Sales 6,578 7,126 7,234 6,646 8,325
Outsourcing, service and rentals 15,215 14,868 13,739 7,820 8,485
Finance income 597 632 660 713 798
Income from continuing operations 1,223 1,328 637 516 265
Income from continuing operations – Xerox 1,195 1,295 606 485 230
Net income 1,223 1,328 637 516 265
Net income – Xerox 1,195 1,295 606 485 230
Financial Position
Working capital $ 2,363 $ 1,531 $ 2,222 $ 5,270 $ 2,700
Total Assets 30,015 30,116 30,600 24,032 22,447
Consolidated Capitalization
Short-term debt and current portion of long-term debt 1,042 1,545 1,370 988 1,610
Long-term debt 7,447 7,088 7,237 8,276 6,774
Total Debt 8,489 8,633 8,607 9,264 8,384
Liability to subsidiary trust issuing preferred securities – – 650 649 648
Series A convertible preferred stock 349 349 349 – –
Xerox shareholders’ equity 11,521 11,876 12,006 7,050 6,238
Noncontrolling interests 143 149 153 141 120
Total Consolidated Capitalization $ 20,502 $ 21,007 $ 21,765 $ 17,104 $ 15,390
Selected Data and Ratios
Common shareholders of record at year-end 39,397 41,982 43,383 44,792 46,541
Book value per common share $ 9.41 $ 8.88 $ 8.59 $ 8.11 $ 7.21
Year-end common stock market price $ 6.82 $ 7.96 $ 11.52 $ 8.46 $ 7.97
Employees at year-end 147,600 139,700 136,500 53,600 57,100
Gross margin 31.4% 32.8% 34.4% 39.7% 38.9%
Sales gross margin 33.7% 34.1% 34.5% 33.9% 33.7%
Outsourcing, service and rentals gross margin 29.0% 30.9% 33.1% 42.6% 41.9%
Finance gross margin 66.8% 63.4% 62.7% 62.0% 61.8%
(1) 2010 results include the acquisition of ACS