Xerox 2012 Annual Report Download - page 12
Download and view the complete annual report
Please find page 12 of the 2012 Xerox annual report below. You can navigate through the pages in the report by either clicking on the pages listed below, or by using the keyword search tool below to find specific information within the annual report.-
 1
1 -
 2
2 -
 3
3 -
 4
4 -
 5
5 -
 6
6 -
 7
7 -
 8
8 -
 9
9 -
 10
10 -
 11
11 -
 12
12 -
 13
13 -
 14
14 -
 15
15 -
 16
16 -
 17
17 -
 18
18 -
 19
19 -
 20
20 -
 21
21 -
 22
22 -
23
-
24
-
25
-
26
-
27
-
28
-
29
-
30
-
31
-
32
-
33
-
34
-
35
-
36
-
37
-
38
-
39
-
40
-
41
-
42
-
43
-
44
-
45
-
46
-
47
-
48
-
49
-
50
-
51
-
52
-
53
-
54
-
55
-
56
-
57
-
58
-
59
-
60
-
61
-
62
-
63
-
64
-
65
-
66
-
67
-
68
-
69
-
70
-
71
-
72
-
73
-
74
-
75
-
76
-
77
-
78
-
79
-
80
-
81
-
82
-
83
-
84
-
85
-
86
-
87
-
88
-
89
-
90
-
91
-
92
-
93
-
94
-
95
-
96
-
97
-
98
-
99
-
100
-
101
-
102
-
103
-
104
-
105
-
106
-
107
-
108
-
109
-
110
-
111
-
112
-
113
-
114
-
115
-
116
-
117
-
118
-
119
-
120
 |
 |
10
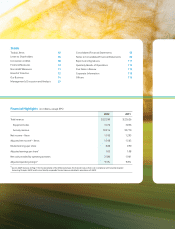
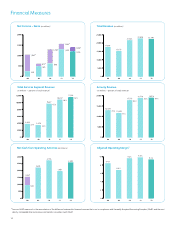
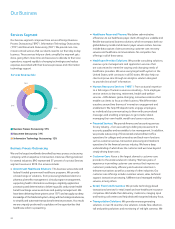
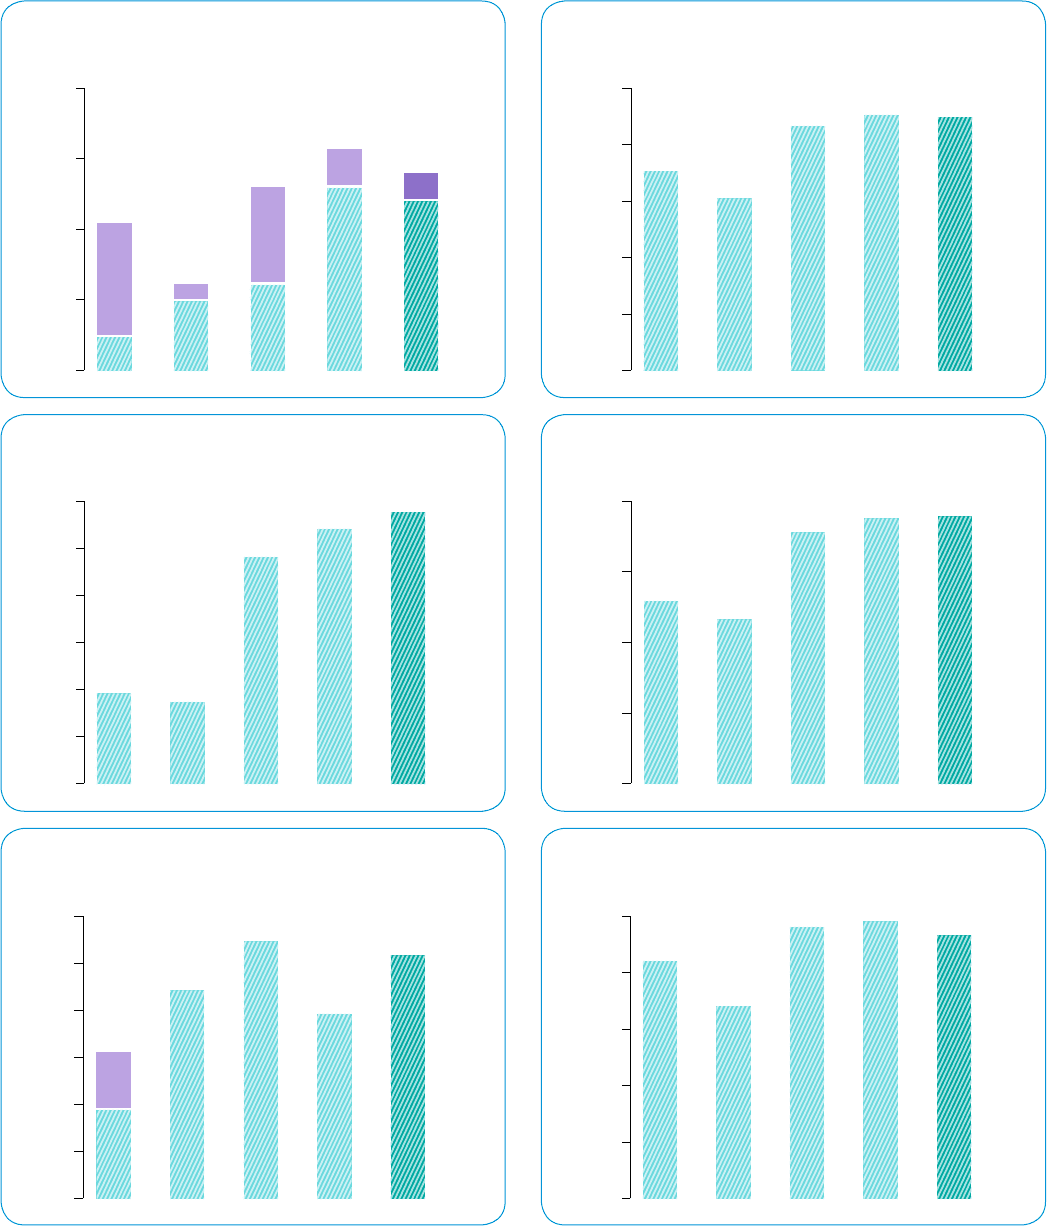
Financial Measures
Net Income – Xerox (in millions) Total Revenue (in millions)
Annuity Revenue
(in millions – percent of total revenue)
Net Cash from Operating Activities (in millions) Adjusted Operating Margin*
* See non-GAAP measures for the reconciliation of the difference between this financial measure that is not in compliance with Generally Accepted Accounting Principles (GAAP) and the most
directly comparable financial measure calculated in accordance with GAAP.
2,000
1,500
1,000
500
0
1,047*
230
613*
485
1,296*
606
1,563*
1,295
1,398*
1,195
‘08 ‘09 ‘10 ‘11 ‘12 ‘08 ‘09 ‘10 ‘11 ‘12
‘08 ‘09 ‘10 ‘11 ‘12
‘08 ‘09 ‘10 ‘11 ‘12 ‘08 ‘09 ‘10 ‘11 ‘12
25,000
20,000
15,000
10,000
5,000
0
17,608
15,179
21,633 22,626 22,390
9.3%
9.8%
9.6%
6.8%
8.4%
10
8
6
4
2
0
3,000
2,500
2,000
1,500
1,000
500
0
1,554*
2,208
2,726
1,961
2,580
939
Total Services Segment Revenue
(in millions – percent of total revenue)
‘08 ‘09 ‘10 ‘11 ‘12
22% 23%
45%
48%
52%
3,828 3,476
9,637
10,837
11,528
2,000
0
4,000
6,000
8,000
10,000
12,000
10,000
15,000
20,000
5,000
0
18,914
18,770
17,776
11,629
12,929
73%
77%
82%
83% 84%