Xerox 2012 Annual Report Download - page 97
Download and view the complete annual report
Please find page 97 of the 2012 Xerox annual report below. You can navigate through the pages in the report by either clicking on the pages listed below, or by using the keyword search tool below to find specific information within the annual report.-
 1
1 -
2
-
3
-
4
-
5
-
6
-
7
-
8
-
9
-
10
-
11
-
12
-
13
-
14
-
15
-
16
-
17
-
18
-
19
-
20
-
21
-
22
-
23
-
24
-
25
-
26
-
27
-
28
-
29
-
30
-
31
-
32
-
33
-
34
-
35
-
36
-
37
-
38
-
39
-
40
-
41
-
42
-
43
-
44
-
45
-
46
-
47
-
48
-
49
-
50
-
51
-
52
-
53
-
54
-
55
-
56
-
57
-
58
-
59
-
60
-
61
-
62
-
63
-
64
-
65
-
66
-
67
-
68
-
69
-
70
-
71
-
72
-
73
-
74
-
75
-
76
-
77
-
78
-
79
-
80
-
81
-
82
-
83
-
84
-
85
-
86
-
 87
87 -
 88
88 -
 89
89 -
 90
90 -
 91
91 -
 92
92 -
 93
93 -
 94
94 -
 95
95 -
 96
96 -
 97
97 -
 98
98 -
 99
99 -
 100
100 -
 101
101 -
 102
102 -
 103
103 -
 104
104 -
 105
105 -
 106
106 -
 107
107 -
108
-
109
-
110
-
111
-
112
-
113
-
114
-
115
-
116
-
117
-
118
-
119
-
120
 |
 |
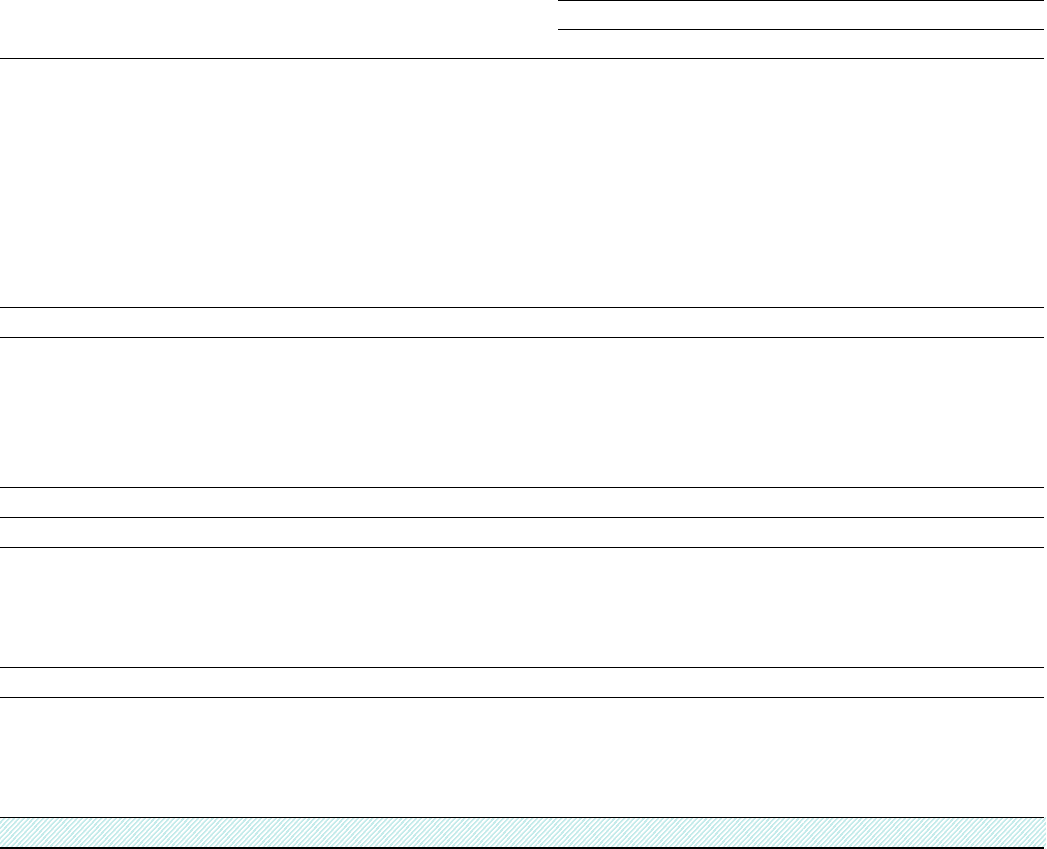
95Xerox 2012 Annual Report
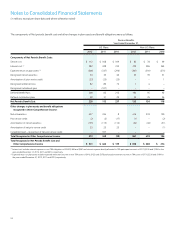
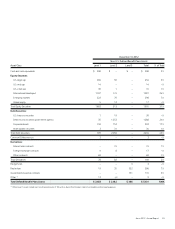
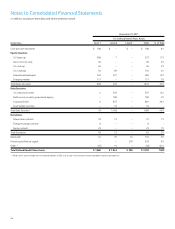
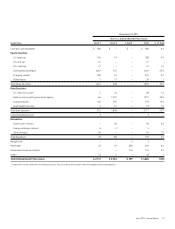
December 31, 2012
Non-U.S. Defined Benefit Plans Assets
Asset Class Level 1 Level 2 Level 3 Total % of Total
Cash and cash equivalents $ 500 $ – $ – $ 500 9%
Equity Securities:
U.S. large cap 204 50 – 254 5%
U.S. mid cap 14 – – 14 –%
U.S. small cap 30 1 – 31 1%
International developed 1,107 174 – 1,281 24%
Emerging markets 322 76 – 398 7%
Global equity 5 12 – 17 –%
Total Equity Securities 1,682 313 – 1,995 37%
Debt Securities:
U.S. treasury securities 1 19 – 20 –%
Debt security issued by government agency 35 1,253 – 1,288 24%
Corporate bonds 150 753 – 903 17%
Asset backed securities 3 31 – 34 1%
Total Debt Securities 189 2,056 – 2,245 42%
Common/Collective trust 2 – – 2 –%
Derivatives:
Interest rate contracts – 74 – 74 1%
Foreign exchange contracts 9 8 – 17 –%
Other contracts 69 – – 69 1%
Total Derivatives 78 82 – 160 2%
Hedge funds – – 3 3 –%
Real estate 19 35 332 386 7%
Guaranteed insurance contracts – – 131 131 3%
Other (1) 13 (4) – 9 –%
Total Defined Benefit Plans Assets $ 2,483 $ 2,482 $ 466 $ 5,431 100%
(1) Other Level 1 assets include net non-financial assets of $5 such as due to/from broker, interest receivables and accrued expenses.