Xerox 2012 Annual Report Download - page 45
Download and view the complete annual report
Please find page 45 of the 2012 Xerox annual report below. You can navigate through the pages in the report by either clicking on the pages listed below, or by using the keyword search tool below to find specific information within the annual report.-
 1
1 -
2
-
3
-
4
-
5
-
6
-
7
-
8
-
9
-
10
-
11
-
12
-
13
-
14
-
15
-
16
-
17
-
18
-
19
-
20
-
21
-
22
-
23
-
24
-
25
-
26
-
27
-
28
-
29
-
30
-
31
-
32
-
33
-
34
-
 35
35 -
 36
36 -
 37
37 -
 38
38 -
 39
39 -
 40
40 -
 41
41 -
 42
42 -
 43
43 -
 44
44 -
 45
45 -
 46
46 -
 47
47 -
 48
48 -
 49
49 -
 50
50 -
 51
51 -
 52
52 -
 53
53 -
 54
54 -
 55
55 -
56
-
57
-
58
-
59
-
60
-
61
-
62
-
63
-
64
-
65
-
66
-
67
-
68
-
69
-
70
-
71
-
72
-
73
-
74
-
75
-
76
-
77
-
78
-
79
-
80
-
81
-
82
-
83
-
84
-
85
-
86
-
87
-
88
-
89
-
90
-
91
-
92
-
93
-
94
-
95
-
96
-
97
-
98
-
99
-
100
-
101
-
102
-
103
-
104
-
105
-
106
-
107
-
108
-
109
-
110
-
111
-
112
-
113
-
114
-
115
-
116
-
117
-
118
-
119
-
120
 |
 |

43Xerox 2012 Annual Report
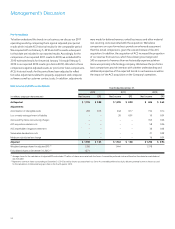
Segment Loss 2012
Other segment loss of $241 million, improved $14 million from the prior
year, primarily driven by a decrease in Other Expenses, Net partially
offset by lower gross profit as a result of the decline in revenues.
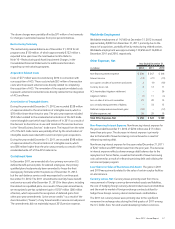
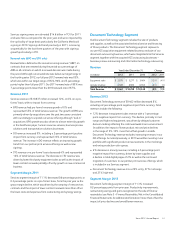
Revenue 2011
Other segment revenue of $1,530 million decreased 7%, including
2-percentage points positive impact from currency, due to a decline
in paper sales, wide format systems and other supplies partially offset
by an increase in revenue from patent sales and licensing as noted
below. Paper comprised approximately 59% of the 2011 Other
segment revenue.
In 2011, we entered into an agreement with another company that
included, among other items, the sale of certain patents and the
cross-licensing of certain patents of each party, pursuant to which we
received an up-front payment with the remaining amount payable
in two equal annual installment payments. Consistent with our
accounting policy for these transactions, revenue associated with this
agreement will be recorded as earned and only to the extent of cash
received. During 2011, the Other segment included revenue and pre-
tax income/segment profit of approximately $32 million and
$26 million ($16 million after-tax), respectively, which is net of certain
expenses paid in connection with this agreement.
Segment Loss 2011
Other segment loss of $255 million, improved $87 million from the
prior year, primarily driven by lower non-financing interest expense and
SAG expense.
(1) See the “Non-GAAP Financial Measures” section for an explanation of this non-GAAP
financial measure.
(2) Color revenues and pages represent revenues and pages from color enabled devices and
are a subset of total revenues and excludes Global Imaging Systems, Inc. (“GIS”).
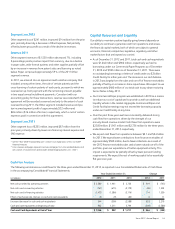
Capital Resources and Liquidity
Our ability to maintain positive liquidity going forward depends on
our ability to continue to generate cash from operations and access
the financial capital markets, both of which are subject to general
economic, financial, competitive, legislative, regulatory and other
market factors that are beyond our control.
• As of December 31, 2012 and 2011, total cash and cash equivalents
were $1,246 million and $902 million, respectively, we had no
borrowings under our Commercial Paper Programs as of December
31, 2012 and $100 million as of December 31, 2011. There were
no outstanding borrowings or letters of credit under our $2 billion
Credit Facility for either year end. The increase in our cash balance
in 2012 was largely from the sales and run-off of finance receivables
partially offset by an increase in share repurchases. We expect to use
approximately $400 million of our total cash to pay down maturing
Senior Notes in May 2013.
• Our Commercial Paper program was established in 2010 as a means
to reduce our cost of capital and to provide us with an additional
liquidity vehicle in the market. Aggregate Commercial Paper and
Credit Facility borrowings may not exceed the borrowing capacity
under our Credit Facility at any time.
• Over the past three years we have consistently delivered strong
cash flow from operations driven by the strength of our
annuity-based revenue model. Cash flows from operations were
$2,580 million, $1,961 million and $2,726 million for the three years
ended December 31, 2012, respectively.
• We expect cash flows from operations between $2.1 and $2.4 billion
for 2013. We expect lower contributions from finance receivables of
approximately $500 million, due to fewer collections as a result of
the 2012 finance receivables sales and a lower natural run-off of the
portfolio, given our expectations of better equipment activity. This
impact is expected to be partially offset by lower pension funding
requirements. We expect the rest of working capital to be essentially
flat year-over-year.
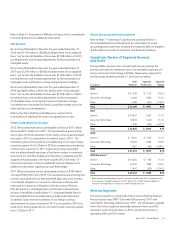
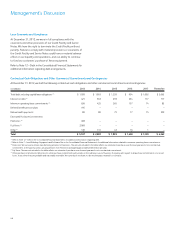
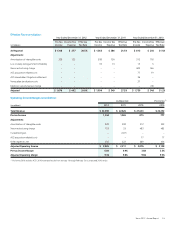
Cash Flow Analysis
The following summarizes our cash flows for the three years ended December 31, 2012, as reported in our Consolidated Statements of Cash Flows
in the accompanying Consolidated Financial Statements:
Year Ended December 31, Change
(in millions) 2012 2011 2010 2012 2011
Net cash provided by operating activities $ 2,580 $ 1,961 $ 2,726 $ 619 $ (765)
Net cash used in investing activities (761) (675) (2,178) (86) 1,503
Net cash used in financing activities (1,472) (1,586) (3,116) 114 1,530
Effect of exchange rate changes on cash and cash equivalents (3) (9) (20) 6 11
Increase (decrease) in cash and cash equivalents 344 (309) (2,588) 653 2,279
Cash and cash equivalents at beginning of year 902 1,211 3,799 (309) (2,588)
Cash and Cash Equivalents at End of Year $ 1,246 $ 902 $ 1,211 $ 344 $ (309)