Xerox 2012 Annual Report Download - page 102
Download and view the complete annual report
Please find page 102 of the 2012 Xerox annual report below. You can navigate through the pages in the report by either clicking on the pages listed below, or by using the keyword search tool below to find specific information within the annual report.-
 1
1 -
2
-
3
-
4
-
5
-
6
-
7
-
8
-
9
-
10
-
11
-
12
-
13
-
14
-
15
-
16
-
17
-
18
-
19
-
20
-
21
-
22
-
23
-
24
-
25
-
26
-
27
-
28
-
29
-
30
-
31
-
32
-
33
-
34
-
35
-
36
-
37
-
38
-
39
-
40
-
41
-
42
-
43
-
44
-
45
-
46
-
47
-
48
-
49
-
50
-
51
-
52
-
53
-
54
-
55
-
56
-
57
-
58
-
59
-
60
-
61
-
62
-
63
-
64
-
65
-
66
-
67
-
68
-
69
-
70
-
71
-
72
-
73
-
74
-
75
-
76
-
77
-
78
-
79
-
80
-
81
-
82
-
83
-
84
-
85
-
86
-
87
-
88
-
89
-
90
-
91
-
 92
92 -
 93
93 -
 94
94 -
 95
95 -
 96
96 -
 97
97 -
 98
98 -
 99
99 -
 100
100 -
 101
101 -
 102
102 -
 103
103 -
 104
104 -
 105
105 -
 106
106 -
 107
107 -
 108
108 -
 109
109 -
 110
110 -
 111
111 -
 112
112 -
113
-
114
-
115
-
116
-
117
-
118
-
119
-
120
 |
 |

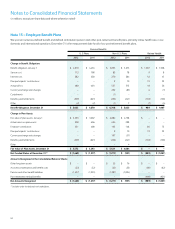
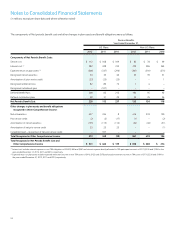
Notes to Consolidated Financial Statements
(in millions, except per-share data and where otherwise noted)
100
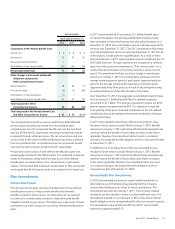
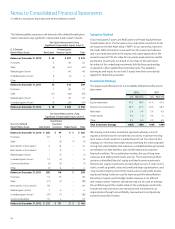
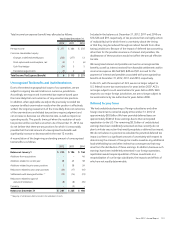
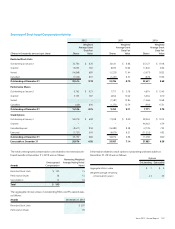
Assumed healthcare cost trend rates were as follows: December 31,
2012 2011
Healthcare cost trend rate assumed for next year 7.5% 8.5%
Rate to which the cost trend rate is assumed to decline (the ultimate trend rate) 4.9% 4.9%
Year that the rate reaches the ultimate trend rate 2017 2017
Assumed healthcare cost trend rates have a significant effect on the amounts reported for the healthcare plans. A one-percentage-point change in
assumed healthcare cost trend rates would have the following effects:
1% i n c r e a s e 1% d e cr e a s e
Effect on total service and interest cost components $ 3 $ (3)
Effect on post-retirement benefit obligation 62 54
Defined Contribution Plans
We have savings and investment plans in several countries, including the U.S., Finland and Canada. In many instances, employees from those
defined benefit pension plans that have been amended to freeze future service accruals will be transitioned to an enhanced defined contribution
plan. For the U.S. plans, employees may contribute a portion of their salaries and bonuses to the plans, and we match a portion of the employee
contributions. We recorded charges related to our defined contribution plans of $63 in 2012, $66 in 2011 and $51 in 2010.
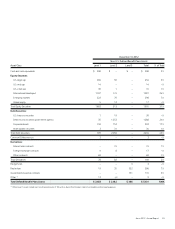
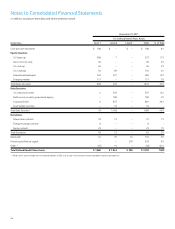
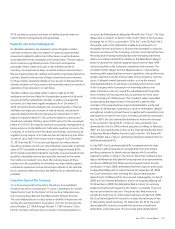
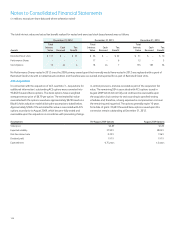
Note 16 – Income and Other Taxes
Income before income taxes (“pre-tax income”) was as follows:
Year Ended December 31,
2012 2011 2010
Domestic income $ 878 $ 917 $ 433
Foreign income 470 648 382
Income Before Income Taxes $ 1,348 $ 1,565 $ 815
Provisions (benefits) for income taxes were as follows:
Year Ended December 31,
2012 2011 2010
Federal Income Taxes
Current $ 24 $ 52 $ 153
Deferred 84 134 (17)
Foreign Income Taxes
Current 123 103 59
Deferred – 38 8
State Income Taxes
Current 34 28 46
Deferred 12 31 7
Total Provision (Benefit) $ 277 $ 386 $ 256
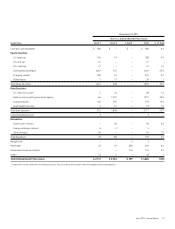
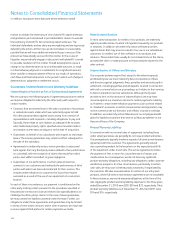
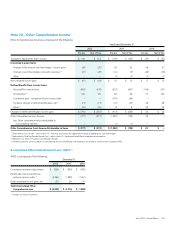
A reconciliation of the U.S. federal statutory income tax rate to the
consolidated effective income tax rate was as follows:
Year Ended December 31,
2012 2011 2010
U.S. federal statutory income tax rate 35.0% 35.0% 35.0%
Nondeductible expenses 2.6% 2.0% 6.3%
Effect of tax law changes 0.7% 0.2% (0.2)%
Change in valuation allowance for
deferred tax assets (0.7)% (0.3)% 2.6%
State taxes, net of federal benefit 2.1% 2.4% 2.0%
Audit and other tax return adjustments (4.7)% (1.0)% (3.6)%
Tax-exempt income, credits and incentives (2.6)% (3.1)% (3.9)%
Foreign rate differential adjusted for
U.S. taxation of foreign profits (1) (11.8)% (10.4)% (6.7)%
Other (0.1)% (0.1)% (0.1)%
Effective Income Tax Rate 20.5% 24.7% 31.4%
(1) The “U.S. taxation of foreign profits” represents the U.S. tax, net of foreign tax credits,
associated with actual and deemed repatriations of earnings from our non-U.S.
subsidiaries.
On a consolidated basis, we paid a total of $137, $94 and $49 in
income taxes to federal, foreign and state jurisdictions during the three
years ended December 31, 2012, respectively.